The answers are no; no; and yes.
The key is the formula for correlation of jointly lognormal variables as given in the answer at Correlation of log-normal random variables. To apply it, without any loss of generality let's assume your model is stationary (for otherwise most of your assumptions don't make sense), that the units of spatial length are chosen to make the exponential correlogram proportional to the function $h\to \exp(-h)$, and that the units in which the response variable is observed are chosen to make this a unit constant of proportionality.
These assumptions amount to the following: there is a Gaussian field $Y$ for which at any two locations $z_1$ and $z_2$ the distribution of $(Y_1,Y_2)=(Y(z_1),Y(z_2))$ is jointly Gaussian with marginal means $(0,0)$ and common variances $\sigma_1^2=\sigma_2^2=1$. Its correlation function $\rho(z_1,z_2)$ depends only on the distance $h=|z_1-z_2|$ between the locations.
Your lognormal field $X$ is given by $X(z) = \exp(Y(z))$. Clearly it is stationary. From the aforementioned formula its correlation function is
$$\tau(h) = \frac{e^{\rho(h)}-1}{e-1} = e^{-h}.$$
Solve this to obtain the correlation function for $Y$ as
$$\rho(h) = \log((e-1)\tau(h) + 1) = \log((e-1)(e^{-h}) + 1).$$
Here is a plot showing how the underlying parameter $\rho$ is related to the lognormal correlation $\tau$:
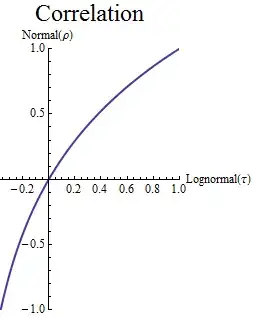
I drew this with a 1:1 aspect ratio to help you see that the Normal (Gaussian) field tends to be a bit more correlated than the Lognormal field for positive correlations.
Because this transformation is approximately linear for positive correlations, applying it to the lognormal correlogram $\tau(h) = \exp(-h)$ gives a function that looks qualitatively similar:
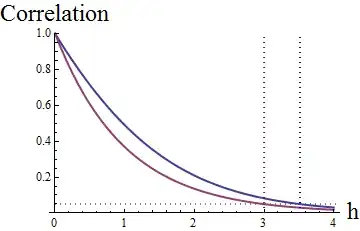
The red curve graphs the exponential model $e^{-h}$, with its characteristic correlation range of $3$ (at the vertical dotted red line). This is where the curve attains a height of $e^{-3}\approx 0.05$ (shown with the gray dotted horizontal line). The blue curve graphs the underlying Gaussian model. Its characteristic correlation range is
$$\log(e-1) - \log\left(e^{1/e^3}-1\right) \approx 3.52.$$
This location is marked by the dotted blue vertical line.
Is this exponential? The answer is no, as made apparent by plotting its logarithm: it will be exponential if and only if the plot is linear. For comparison, the next figure also plots the log of $\tau(h)$ (in red), which is linear.
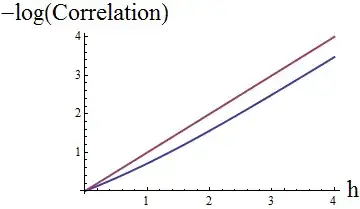
The blue (Gaussian) curve is almost, but not quite, linear: it starts out rising less steeply than the blue curve, and then seems to straighten out to about the same slope. Referring back to the second figure showing the two correlograms, the slope of the exponential correlogram (red, for the Lognormal field) is $-1$ at the origin whereas the slope of the blue curve (for the Gaussian field) is $-1+1/e\approx -0.63.$
This difference may be minor in applications, but it shouldn't be ignored. The reason is that important characteristics of the random field are reflected in the slope of the correlation function near $0$: a larger slope corresponds to less smoothness.
This analysis has
Quantitatively related the correlation structures of Gaussian fields and their exponentials (the corresponding Lognormal fields).
Demonstrated that the characteristic correlation length of the Gaussian field is a little greater than that of the Lognormal field.
Demonstrated that when the Lognormal field has an exponential correlogram (or semivariogram), the underlying Gaussian field does not have an exponential correlogram: it differs by being a little less steep near the origin.


