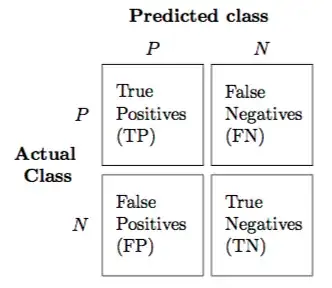
Recognition rate
Eurostat uses recognition rate for your idea of truthiness:
The number of positive decisions on applications for international
protection as a proportion of the total number of decisions
Same definition is used in the researchgate forum:
recognition rate= (no. of correctly identified images / Total no. of images)*100
One could expand it to:
- positive recognition rate:
TP/(TP+TN) = TP/all
- negative recognition rate:
TN/(TN+TP) = TN/all
Predicted positive condition rate (PPCR)
Apart from the recognition rate, there exists a measure that might also fit. It is the
$\text{Predicted positive condition rate}=\frac{tp+fp}{tp+fp+tn+fn}$
... which identifies the percentage of the total population that is flagged. For example, for a search engine that returns 30 results (retrieved documents) out of 1,000,000 documents, the PPCR is 0.003%.
See: Precision and recall and go to "Imbalanced data" at the bottom middle
If you take out the FP and FP (for example, because your database simply does not include missing rows in its label calculations), you get a sort of true term of the PPCR, a PPCR filtered for true test results:
- $\text{Predicted positive condition rate (true only)} = \frac{tp}{tp+tn}$
And finally, just inventing a name now: dropping the false test results might mean that the condition is always true. Which would then allow the naming:
- "Predicted positive true rate" (PPTR)
Which is what you wanted to create. But my name invention might not fit, I might misunderstand the word "condition" here. And since the examples of the recognition rate clearly drop the false test results, it is probably better to use tp/all as "recognition rate".
Example
++ Update and warning ++
This example is probably wrong. It turned out that the TN in the example were FP in reality, and the TN and the FN were instead the observations that were excluded from the dataset. With the example at hand, I could only calculate precision in the end (no recall, since that needs FN, and no "recognition rate", since that needs TN). Therefore, the example given is probably flawed. I leave it just as an idea.
I have the real case of a dataset where FP and FN cannot exist by design. Of course, in the model, a label is always True since the metrics are not about questioning the labels but the predictions. Only the predicted class can be True or False. And in my case, the label is already an evaluation of an observation, being
"yes"
if the prediction is correct and
"no"
if not.
A prediction is True or False (T or F), and the Positives are those cases where the prediction predicts the class of interest, while the Negatives stand for those where that class is not predicted.
But what would be a False Negative or False Positive here? A FN would be a label saying that the prediction is wrong, while the prediction is actually right. Which makes no sense since the label is right by definition. A FP would be a label saying that the prediction is correct, while the prediction is actually wrong. Which makes no sense either.
There are only TP (hit) or TN (correct rejection) by design in that dataset. The same link shows FN as "type II error, miss, underestimation" and FP as "type I error, false alarm, overestimation" which both simply cannot appear since the prediction evaluation which we need to compare it to the label column is the same as the label: a wrong prediction gets a "no" label, and a correct prediction gets a "yes" label. There is no wrong prediction that is correct (label "yes") or a correct prediction that is wrong (label "no").
In that case I do not see any chance of using the common metrics like Recall or Precision or even accuracy which all need false test results, and your idea of "truthiness" is relevant.
