Here I simply cite an excerpt from one SPSS tutorial document on doing Exact testing with nonparametric tests (such as Mann-Whitney).
When asymptotics break down
Modern statistical methods rely on the results of mathematical
statistics, which have established theorems and distributional results
that hold true “in the limit” for larger sample sizes, or
asymptotically. You should be concerned that asymptotic results do not
apply if:
- the sample size is small;
- data [e.g. crosstables] are sparse;
- data are skewed in distribution across groups; or
- data are heavily tied.
If any of these conditions are true for your data, the p-value at
which you operate can be different from the asymptotic p-value, and
you can come to incorrect conclusions.
While the above conditions may seem intuitively simple, it is
difficult to make recommendations in practice. It is tempting to try
to come up with a rule of thumb stating that some sample size is small
while another is large. Yet, the effort to do so is too simplistic
because it ignores other elements of structure, such as the degree of
imbalance in the data.
For example, with regard to sparseness in contingency tables, two
commonly cited rules of thumb are:
- the minimum expected cell count for all cells should be at least 5;
- for tables larger than 2x2, a minimum expected count of 1 is permissible as long as no more than about 20 percent of the cells have
expected values below 5.
The problem is these (and other) rules are sometimes unduly
conservative. Once again, it is difficult to find a rule that always
holds true. When faced with sparseness, some researchers collapse
categories to conform to the above rules. However, collapsing
categories cannot be recommended because it can seriously distort what
the data convey about associations.
Skewness refers to imbalance in group sizes. When you perform studies
prospectively, you can sometimes ensure groups are balanced. When
studies are done retrospectively, or you are studying a relatively
rare event or phenomenon, you may have little control over balance. A
rule of thumb is the “80:20 Rule.” This rule assumes two things:
- data are relatively balanced if skewness is no more extreme than 80:20;
- this applies to every subgroup of interest.
When skewness is extreme, even seemingly large sample sizes might be
inadequate.
A common reason for ties is measurement. In areas such as medical
studies or the social sciences, researchers use ordered items and
scales and end up lumping together subjects that are otherwise
distinct – if it were possible to measure them using some quantitative
metric. In these situations, one obvious remedy is to get more data.
However, because of time or cost, this is not always possible.
Instead, the methods of exact statistics have shown great promise.
Exact statistics
For a given data set and test situation, you can generate a reference
set of like data of which the observed data are a particular
realization. Having generated repeated realizations, you will know how
discrepant the observed data are relative to a “universe” of like
data. The fraction of possible realizations at least as discrepant as
the observed data generate an exact p-value.
Generating an exact p-value is computationally intensive. Fortunately,
advances in statistical computing, coupled with advances in computing
power, have made it possible to quickly calculate exact p-values for
common statistical situations.
Note that exact test methodology does not necessarily rely on “brute
force” evaluation of all possible tables in a reference set – that may
take a very long time. Instead, sophisticated algorithms make it
possible to calculate a p-value by implicit, rather than explicit,
enumeration of the reference set. Other things equal, exact methods
work faster on small data sets than large ones. And, known approaches
on large data sets may be too time-consuming. However, for large and
well-balanced data sets, asymptotic statistical results apply.
When you want an exact p-value but it would take too long to compute,
you can conveniently generate a Monte Carlo interval that will contain
the exact p-value with specified confidence.
Although exact results are always reliable, some data sets are too
large for the exact p value to be calculated, yet don’t meet the
assumptions necessary for the asymptotic method. In this situation,
the Monte Carlo method provides an unbiased estimate of the exact p
value, without the requirements of the asymptotic method. The Monte
Carlo method is a repeated sampling method. For any observed table [a
crosstable of frequencies that is a nonparamereic test's base], there
are many tables, each with the same dimensions and column and row
margins as the observed table. The Monte Carlo method repeatedly
samples a specified number of these possible tables in order to obtain
an unbiased estimate of the true p value.
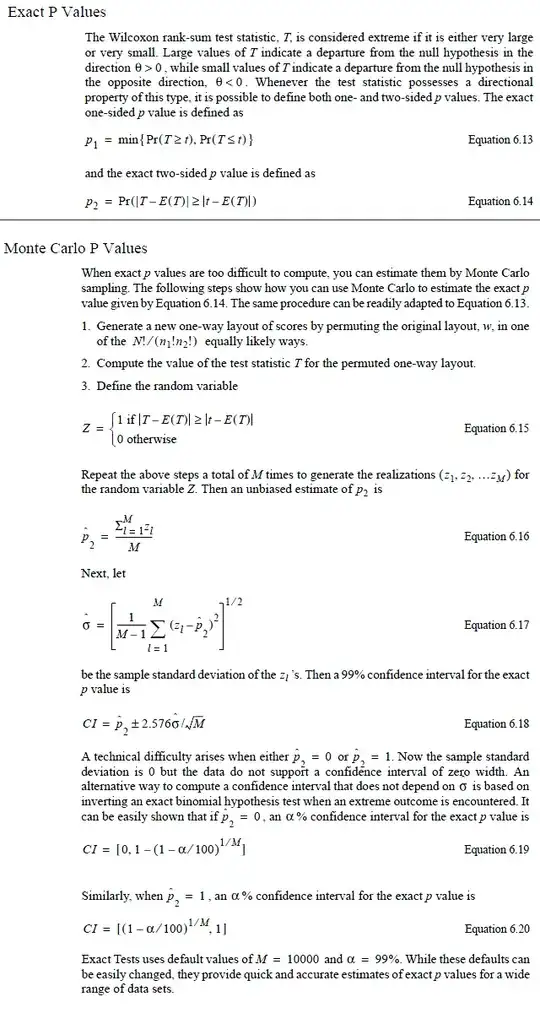
Another quote from SPSS documentation, showing formulas for Mann-Whitney Exact and Monte Carlo exact significance estimation:

