We have the following model that was proposed to me. It takes yes, no and maybe responses to try and predict attendance $y_{i}$.
$$ \begin{align} y_i &\sim \mathsf{Bin}(n, p_i) \\ p_i &= \mathrm{logit}^{-1}\big(\beta_0 + \beta_1 I_{X=1} + \beta_2 I_{X\in (0,1)} x_i\big) \end{align} $$
dummy variables: $I_{X=1}$ that returns 1 if $X=1$ and 0 otherwise, and $I_{X∈(0,1)}$ that returns 1 if X is in the (0,1) range (i.e. excluding the exact 0 and 1) and 0 otherwise
Such that : $$ \mathrm{logit}(p_i) = \begin{cases} \beta_0 & X = 0 \\ \beta_0 + \beta_1 & X = 1 \\ \beta_0 + \beta_2 x_i & X \in (0, 1) \end{cases} $$ This was explained to me by a user named Tim and seems a lot better than my original idea.
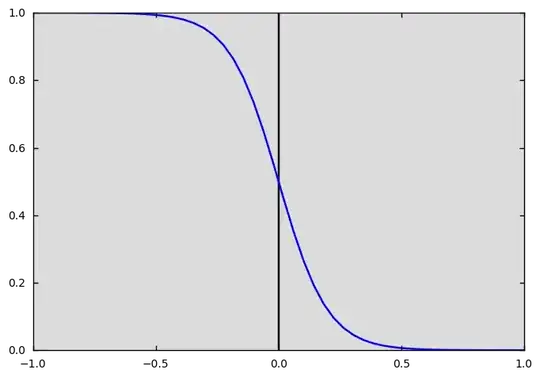
So I am able to get $p_{i}$ but I don't quite think I actually understand what I am getting. It's obviously a logistic function as $p_{i}$ vs $z(x)$ where $z(x) = \mathrm{logit}^{-1}\big(\beta_0 + \beta_1 I_{X=1} + \beta_2 I_{X\in (0,1)} x_i\big)$. My problem is in interpreting the graph in terms of probability of attending or not attending and how I should fit it to the given binomial distribution. I get the following. Note the $z$ values.
The above graph is much different to something like this which would sum up to one. I would interpret values where $z>0$ as probability to attend and $z<0$ as not attending probability.
Should I perhaps rescale the $z$ values by dividing by $n$ to get a domain of $[-1,1]$
Really not sure here to be honest. Would you please explain this to me please. Thank you.
Link to original question: Bayesian Modeling: Yes, No and Maybe Responses

