1

Let’s say

$X_1$ ~ $uni(0,1)$

$X_2$ ~ $uni(0,1)$

$X_3$ ~ $uni(0,1)$

And

$Y=0.1X_1+0.3X_2+0.6X_3$

What’s the $F(Y)$ (i.e., CDF)?
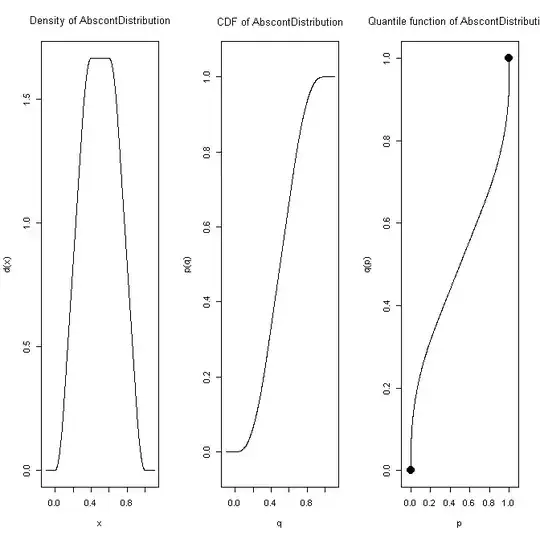
user9292
  • 1,324
  • 2
  • 17
  • 31

1 Answers1

6

It is not one of the common named distributions, but the distr package in R can help you explore it:

library(distr)

d <- 0.1*Unif() + 0.3*Unif() + 0.6*Unif()
plot(d)

enter image description here

Greg Snow
  • 46,563
  • 2
  • 90
  • 159
  • Is it possible to make the figures a little less tall so that it's a little easier to see what's going on? Stacking them vertically might work better for this particular interface. :) – cardinal Jul 06 '12 at 21:14
  • 1
    This is the default plot, you can also access the information to plot each individually and therefore arrange them however you want (or only plot a subset). You can do additional manipulations, or generate random observations from the distribution as well. – Greg Snow Jul 06 '12 at 21:43
  • (+1) Good information and interesting package. As Michael notes, it might help to make the independence assumption explicit. – cardinal Jul 06 '12 at 21:46
  • @cardinal, good point, my solution assumes independence. – Greg Snow Jul 06 '12 at 21:51
  • Thanks! this is very helpful, but can we find a closed form of $F(Y)$? – user9292 Jul 07 '12 at 16:41
  • Yes, you can find a closed form: but it has to be written as seven formulas for the intervals demarcated by $0,.1,.3,.4,.6,.7,.9,$ and $1$. For instance, for $t\in [0,0.1]$ the PDF is $250t^2/9$ while for $t\in [0.1,0.3]$ it equals $5(20t-1)/18,$ *etc.* That's because uniform PDFs are discontinuous at $0$ and $1$, leading to functional breaks in the PDFs and CDFs of their linear combinations at various places. See http://stats.stackexchange.com/questions/41467. – whuber Apr 21 '14 at 18:17