1

Possible Duplicate:
How should I transform non-negative data including zeros?

I want to log-transform some of my data because the Levene's homogeneity of variances test rejected the null hypothesis for those sets, before performing a two-way balanced ANOVA.

Now, some of the data I collected have null values, because they are related to my plants' tillers, and some of them didn't have any.

So for my log-transformation, should I simply use the formula =LOG(x+1) (in LibreOffice Calc) so those null values go back to 0? Or the value of the constant I add depends on how the datasets look? For example, I have weights that range from 0 to 12 grams, other weight that range from 0 to 1.5 grams, and leaf area ranging from 0 to 565 cm². Would =LOG(x+1) be ok for data ranging from 0 to 565, but not for data ranging from 0 to 1.5?

Here are some histograms to show how my data is distributed:

enter image description here

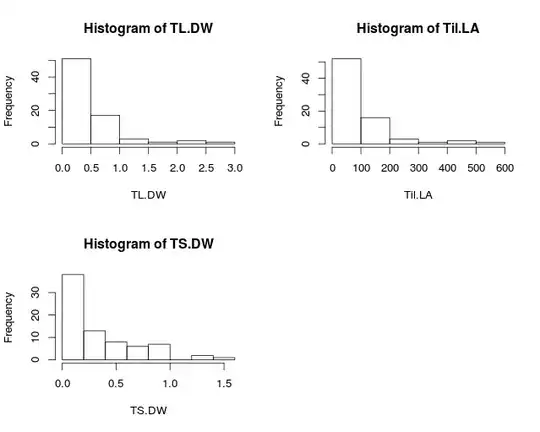
What do you think? Thanks in advance!

stragu
  • 429
  • 1
  • 4
  • 12
  • 2
    This question may be relevant: http://stats.stackexchange.com/questions/1444/how-should-i-transform-non-negative-data-including-zeros – mogron Jul 05 '12 at 08:37
  • 2
    as well as: http://stats.stackexchange.com/questions/30728/how-small-a-quantity-should-be-added-to-x-to-avoid-taking-the-log-of-zero – Stéphane Laurent Jul 05 '12 at 08:53
  • 1
    specially this part http://stats.stackexchange.com/a/1630/603 – user603 Jul 05 '12 at 11:18
  • 1
    These discussion go into issues of adjusting 0 when tranforming to the log. But the log transformation is generally done to adjust for skewness. The square root transformation seems to be a more common choice for variance stabilization. In this case the histograms look skewed probably because of the truncation to 0. I don't think doing a log transformation is a good idea in this type of situaation. – Michael R. Chernick Jul 05 '12 at 11:26

0 Answers0