0

I am studying share price log returns and AR(1) model.

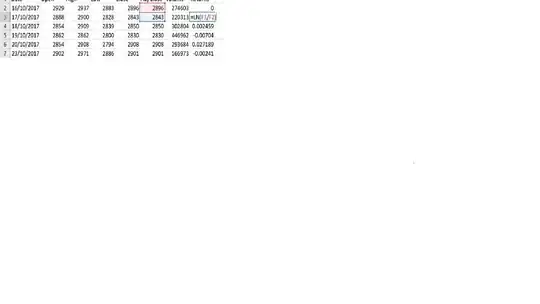
I downloaded data from FTSE100 and used the Adj.close column to find the Ln returns:

enter image description here

enter image description here

Now I am trying to understand how can I estimate an AR(1) model using this information. I understand the AR(1) model, I did a couple of example in excel, but I do not understand how the ln returns are related to that. AR(1) is given by:

$X_t=\phi+\alpha*X_{t-1}+\epsilon$

I assume that I need to find values for $\phi$ and $\alpha$ to try to fit the AR(1) model but I am confused. Can anyone help me on this? Thanks.
Tim
  • 108,699
  • 20
  • 212
  • 390
user290335
  • 167
  • 1
  • 9

1 Answers1

1

Since you are doing this in Excel, the simplest way would be to use linear regression (but not the best). Notice that if your model is

$$ Y_t = \phi + \alpha Y_{t-1} + \varepsilon_t $$

that it is basically the same as standard linear regression model

$$ Y_t = \beta_0 + \beta_1 X_t + \varepsilon_t $$

with $X_t = Y_{t-1}$.

Assuming that your $Y_t$ variable is stored in the A1:A100 cells, put lagged $Y_{t-1}$ in B2:B100 cells, by inserting there =A1:A99. Then you can extimate $\alpha$ =SLOPE(A2:A99, B2:B99) and $\phi$ =INTERCEPT(A2:A99, B2:B99).

Tim
  • 108,699
  • 20
  • 212
  • 390