Since I'm looking into the gap statistics just now, I'll try to answer this old question.
$\newcommand{\Gap}{{\rm Gap}}$
Once you have partitioned your datapoints into $k$ clusters using e.g., k-means, you want some metric that describes how compact the clusters are. One way of doing this is to compute all the pairwise distances between points within a cluster and average these distances. Do this for all clusters, sum these average distances and take the log. This is $\log(W_{k})$ in Tibshirani et al. 2001.
If clusters are real and very compact, $W_{k}$ will be low. However, we need some baseline reference to tell what "low" means. For this we ask what $W_{k}$ values we can expect from a dataset similar to the one we have but where there are no clusters at all. The largest the difference between the observed $W_{k}$ and the "null" $W_{k}$ the more confident we are that the number of clusters is correct.
Say our dataset has $n$ datapoints in $d$ dimensions. Tibshirani et al. show that such reference dataset can be obtained by taking $n$ datapoints where the coordinate of each datapoint is drawn from a uniform distribution. The minimum and maximum of the uniform distribution in each dimension is given by the min and max of the observed datapoints in that dimension.
Then cluster this reference dataset using the same strategy you used for the real dataset (e.g., k-means with $k$ clusters), calculate its $W_{k}$, and compute the difference between observed $\log(W_{k})$ and reference $\log{W_k}$. Of course, one randomly drawn dataset is not a reliable reference. Instead you draw several datasets and average the resulting $\log(W_{k})$'s. This is $E^{*}\{\log(W_{k})\}$ and the difference $E^{*}\{\log(W_{k})\} - \log(W_{k})$ is the gap statistic.
Tibshirani et al. also show that it is even better to rotate the dataset and remap the datapoints on the principal component axes and use this rotated dataset to draw the reference null datasets. This gives better results since the original variables (dimensions) may be correlated to each other. After rotation, the correlation has been eliminated.
Here's an example using simulation in R. First I produce an example dataset with 2 dimensions and 3 real clusters of 20 observations each.
library(data.table)

options(digits= 3)
set.seed(1234)

K <- 3
ksize <- 20

M <- rbind(
    mvrnorm(n= ksize, mu= c( 5,  5), Sigma= diag(c(1,1))),
    mvrnorm(n= ksize, mu= c( 5, 10), Sigma= diag(c(1,1))),
    mvrnorm(n= ksize, mu= c(10, 10), Sigma= diag(c(1,1)))
)
data <- data.table(M, cluster= rep(LETTERS[1:K], each= ksize), observation= 1:nrow(M))

plot(data$V1, data$V2, col= rep(1:K, each= ksize), pch= 19, xlab= 'Dim 1', ylab= 'Dim 2')

# 60 observations in 2 dimensions
M
       [,1]  [,2]
 [1,]  4.87  3.79
 [2,]  5.49  5.28
 [3,]  5.44  6.08
 [4,]  4.54  2.65
       ...
[57,] 11.24  8.87
[58,]  9.83 10.88
[59,]  9.33 10.97
[60,] 10.03 12.12
This is a convenience function that given the observations X calculates all the pairwise Euclidean squared distances, and averages them (as per Tibshirani et al).
avg.dist2 <- function(X) {
    dist2 <- dist(X)^2
    avg   <- sum(dist2)/(2 * nrow(X))
    return(avg)
}
Here I cluster the dataset using k-means and compute $\log(W_{k})$:
k  <- 3
km <- kmeans(M, centers= k)
data[, cluster := km$cluster]

logW <- log(sum(data[, list(d2= avg.dist2(X= cbind(V1, V2))), by= cluster]$d2))
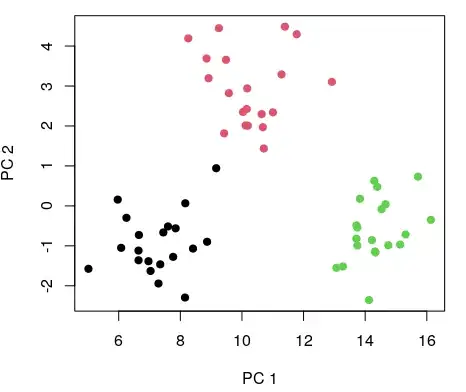
Now I produce the reference datasets. First I rotate the observed data by centering its columns (i.e, subtract from each value the mean of its column), and multiplying it by its eigenvectors (eigenvectors obtained from singular value decomposition):
M_cent <- scale(M, center= TRUE, scale= FALSE)
M_rot  <- M %*% svd(M_cent)$v
plot(M_rot[,1], M_rot[,2], col= rep(1:K, each= ksize), pch= 19, xlab= 'PC 1', ylab= 'PC 2')
Now I can draw the reference datasets, cluster them, compute $W_{k}$ for each randomly drawn datasets - the same as for the real data. Note the use of runif(..., min= min(M_rot[,v]), max= max(M_rot[,v])) to create new datapoints.
B <- 500
null_logW <- rep(NA, B)
for(i in 1:length(null_logW)){
    null_M <- matrix(data= NA, ncol= ncol(M_rot), nrow= nrow(M_rot))
    for(v in 1:ncol(M_rot)){
        null_M[,v] <- runif(n= nrow(M_rot), min= min(M_rot[,v]), max= max(M_rot[,v]))
    }
    null_km <- kmeans(null_M, centers= k)
    null_M  <- as.data.table(null_M)
    null_M[, cluster := null_km$cluster]
    null_logW[i] <- log(sum(null_M[, list(d2= avg.dist2(X= cbind(V1, V2))), by= cluster]$d2))
}
plot(null_M$V1, null_M$V2, col= null_M$cluster, pch= 19, xlab= 'Dim 1', ylab= 'Dim 2')
This is an example of one of the random datasets:
Finally, average the null $\log(W_{k})$ and compute the gap statistics. As suggested by Tibshirani et al we should compute also the standard deviation of the null distribution to guide the choice of best number of clusters:
ElogW <- mean(null_logW) # 4.88
sdk   <- sqrt((1 + 1/B) * sum((null_logW - mean(null_logW))^2)/B) # 0.0988
gap   <- ElogW - logW  # 1.04
Now, by replacing k <- 3 with e.g. k <- 2 or 4, 5 etc you can find the optimal number of clusters according to the gap statistics. I.e., the k so that $\Gap(k)\ge \Gap(k+1)-sd_{k+1} $.
Credit: I found the code here the-gap-statistic quite handy to understand myself.


