There are many time serious questions but I can't seem to find one that explains my case. I have a set of timeseries that are the output of many simulations where the value of the same parameter is changed in each simulation. I would like to compare each time series with the time series from the control simulation. The frequency and duration of all time series is the same. The value at time t depends on the value at time t-1 (in most cases), so I guess you would call these auto-correlated time series. These are values of number of plants or kg of biomass produced, or average height. I would like to know if there is a statistical significance between each time series and the control to determine the magnitude of the effect that this parameter has on the simulation output. I was thinking of comparing the mean and standard deviation using a t-test, but I am not sure if these timeseries are auto-correlated.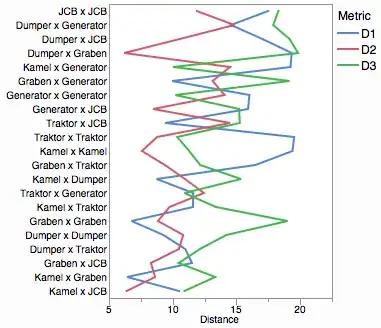
- 249
- 2
- 10
-
Please post a csv file with two columns – IrishStat Sep 21 '17 at 15:05
-
You can test for the difference in means (t-test), or the difference in variances/st.devs (F-test). However as you pointed it out, first make sure that the sample of values you are using are i.i.d. The first thing to test is, as you also pointed, the temporal dependence, so an autocorrelation testing is the first thing to do. – Alexey Burnakov Sep 21 '17 at 15:36
1 Answers
To parametrically test the equivalence of two means one needs to have data that is i.i.d. as @Alex Burn pointed out. What this means (pun intended) is that each series (separately) needs to be i.i.d or the resultant of an ARIMA process with an i.i.d error variance. Additionally each series error process needs to be free of deterministic structure (pulses/step shifts/seasonal pulses/time trends) AND have a constant error process over time.
I took your first series (SIM) into AUTOBOX (my tool of choice). The program's heuristics iterated (studiously avoiding using a presumptive list-based procedure) to the following model.
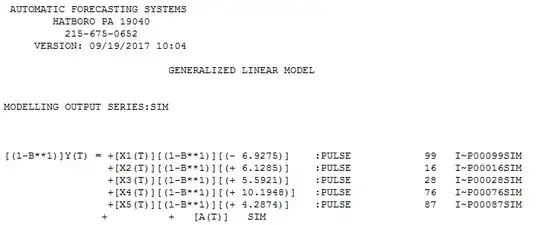 where a few pulses are identified AND a significant reduction in error variance see (http://docplayer.net/12080848-Outliers-level-shifts-and-variance-changes-in-time-series.html) (
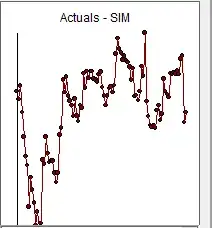 visually obvious ) at period 43
  . This reduction is also clear from your graph if you mentally adjust for the few anomalies
The actual/cleansed graph is also very revealing 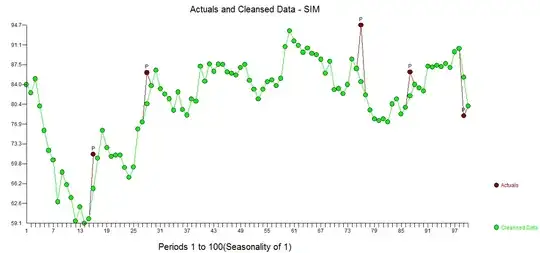 . So in summary the underlying model/characterization is that of a random walk where the expected value or mean is 0.0. If your simulation used another starting point then that would be the expected value or mean.
Now as a second step I took the second series called CONTROL here  and AUTOBOX formed
  . This second series had pulses at different points in time and did not evidence a change in error variance. Here is the actual/cleansed graph
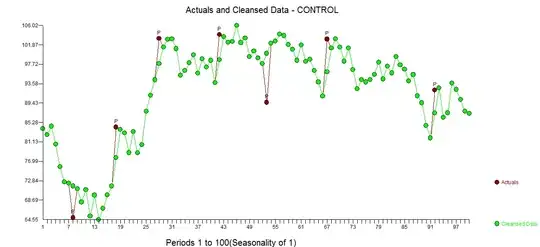
In summary both series ultimately had a white noise error process confirming the results of a tour de force to separate signal and noise. The identified pulses are different save for period 28.
In summary both model are fundamentally random walks and thus could be referred to as being similar (but with important differences) . In my opinion your comment that your "kind of question" had not been seriously addressed is largely true because one has to initially identify what might be a common DGF ( Data Generating Function) and if a constant mean could be detected then a test might be formuable.
Hope this helps.
- 27,906
- 5
- 29
- 55
-
Whether the series are random walks or anything else would seem to be beside the point. After all, one of them is *simulated*: the OP knows exactly how it was generated. Doesn't the question ask about how to *quantify the differences* between them? The plot makes it clear that they are different--and no amount of modeling will change that fact. – whuber Sep 21 '17 at 19:19
-
I totally agree with you the series are different ( probably due to starting values) . The issue is that if they were not fundamentally random walks with no drift then a formal test could be developed. He may think that he knows how it was simulated BUT that is not always what comes out due to unforeseen (uncontrolled) circumstances. The empirical identification of different pulses is interesting (to me) – IrishStat Sep 21 '17 at 19:25
-
I don't see why that should be the case. The question seems ill-formed at present, because it doesn't specify what is of interest in the comparison. As a simple example, if interest focuses on the values at the final time, then comparing those values is routine--and demonstrating that these are random walks supports assuming the difference has a Normal distribution, allowing direct application of routine tests like t-tests. (However, I doubt the OP really needs to be concerned about "statistical significance": the application described in the question ought to focus on effects.) – whuber Sep 21 '17 at 19:29
-
-
@IrishStat Thanks for looking into this. The two models start from the same state, this state is reached after the control simulation runs for x amount of years. Then at year x a parameter is changed in one simulation, while the other follows unchanged. I am interested in knowing the effect of this parameter on the output of the simulation. I am not interested in only the final value, because this is a system that oscillates (think a population that has growing and declining cycles) – Herman Toothrot Sep 22 '17 at 08:04
-
@whuber I would like to know if the mean of the two time series is statistically different, can I take the two series and apply a t-test? I don't need anything too complex but justifiable when reviewed. I also calculated the % of change between the two, simply mean of simulation 1- mean of control)/mean of control – Herman Toothrot Sep 22 '17 at 08:11
-
@IrishStat I think the cleaning process might be useful but overall it doesn't change a lot the overall mean or variance. – Herman Toothrot Sep 22 '17 at 08:14
-
The "cleaning process" is simply a possible way to condition or adjust the observed series before analysis . In this case data exploration lead to the discovery of anomalies and a variance change in one series. Your goal to simply test means as a way of characterizing the two series is ill-fated as the observed data id not i.i.d.. Possibly the best you can do is to identify possible similarities and differences between the two series. I believe that was accomplished. In summary various "student t test of means" is applicable under well-specified assumptions which are not met by your data. – IrishStat Sep 22 '17 at 12:05
-
Although you asked for a test of means to characterize the two series , another possible test is to measure the degree of co-relationship . This discussion might be of interest as Intervention detection (data cleansing) can be helpful in analyzing the co-relationship between two series https://stats.stackexchange.com/questions/245931/is-there-a-version-of-the-correlation-coefficient-that-is-less-sensitive-to-outl/245935#245935 – IrishStat Sep 22 '17 at 12:14
-
You cannot directly apply a t-test because the data will likely be (strongly) correlated. One of the best ways to analyze this situation is to understand the specifics of the simulation: that will reveal the statistical characteristics that must be known in order to recommend a procedure to compare the series. – whuber Sep 22 '17 at 15:47
-
@whuber . Can you work this out . Assume a rw and an initial value = first value (83.959) for the SIM series with sigma=2.7 – IrishStat Sep 22 '17 at 19:55
-
-
it would appear that the SIM series was affected at period 43 , essentially reducing variability. This "variability reduction conclusion" premises that the underlying process (i.e autoprojective parameters) did not change. If the autoprojective parameters did change this can often lead to a change in model error variance. Based upon that period 43 is very suspect and may be the point you are looking for.to declare divergence of the two series.Detecting error variance change is discussed here http://docplayer.net/12080848-Outliers-level-shifts-and-variance-changes-in-time-series.html – IrishStat Sep 23 '17 at 14:16
-
@IrishStat what details would be helpful? The model is deterministic, there is no variability from simulation to simulation unless a parameter is changed. So I believe this point is important as it reduces already the complexity of the model output. – Herman Toothrot Sep 30 '17 at 17:36
-
Also, this is just one example, I have many time series with more dubious relationships. Like these https://imgur.com/a/NvQL4 – Herman Toothrot Sep 30 '17 at 17:55
-
at this point I am confused and perhaps if we have a dialogue I may be able to help as monologues are failing. – IrishStat Sep 30 '17 at 18:45
-
@IrishStat I will send you an email, I guess this is too complicated to discuss in the comment's section. – Herman Toothrot Oct 02 '17 at 12:46
-
better yet give me a call on my land line as a conversation may help us both or SKYPE me – IrishStat Oct 02 '17 at 13:00
-
-
-
i had to totally reinstall SKYPE . please send me your SKYPE ID ..possibly via email to dave@autobox.com – IrishStat Oct 05 '17 at 15:48
-