Suppose I'm trying to figure out the relationship between home-ownership and wine drinking.
My information on where home-owners live comes from the census, and it divides a given geographical area up into zones like this:
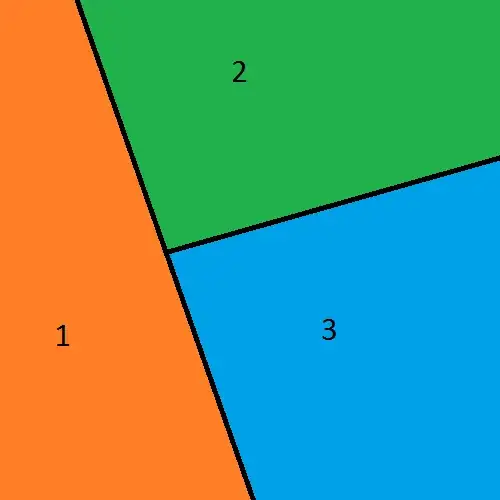
This (made up) data is organized like this:
Census Zone |   Home-ownership rate
____________|______________________
1           |   45%
2           |   49%
3           |   63%
etc         |   etc
(it also tells me things like total population and population density)
I get my data on wine consumption from The International Alkie Confederation, and their data looks like this:

Wine Zone   |   Wine drunk per capita per year in litres
____________|____________________________________________
A           |   8
B           |   10
C           |   11
D           |   0
E           |   3
etc         |   etc
So what's the best way of combining these two datasets? For example, can I look at how each wine-zone intersects with each census-zone, and take a weighted average based on how much area they overlap? (Let's assume I have all the shapefiles for each subdivision so I can do this sort of procedure)

e.g. Wine-zone C might be something like 60% census-zone 2, and 20% each of CZ-1 and CZ-3, resulting in a weighted average of 51% home-ownership for that wine-zone.
Resulting in a table like this:
Wine Zone   |   Wine drunk  |   Home-ownership (estimate)
____________|_______________|_____________________________________
A           |   8           |   39%
B           |   10          |   49%
C           |   11          |   51%
D           |   0           |   43%
E           |   3           |   52%
etc         |   etc         |   etc
Obviously this wouldn't be completely accurate, because it would assume that each census area has a homogeneous population distribution (e.g. the small slice of CZ-1 might not be a representative sample of all of CZ-1).
But still, if I did this across the entire dataset, would all of these errors "wash out" and give me a meaningful comparison? Also, how can I estimate the error in doing this? Is there a name for this kind of analysis where I can google search for more information?