5

Why "softmax" is called "softmax"? How is it related to "max"?

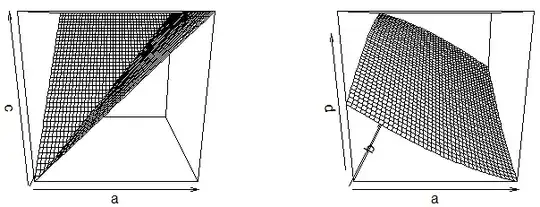
I am trying the following code and the results do not look like each other:

a = seq(-1,1,0.05)
b = seq(-1,1,0.05)

softmax <- function(x,y) {
  exp(y)/(exp(x)+exp(y))
}

par(mfrow=c(1,2))

c = outer(a,b,pmax)
persp(a,b,c)

d = outer(a,b,softmax)
persp(a,b,d)

enter image description here

The two plots are not similar at all.
Haitao Du
  • 32,885
  • 17
  • 118
  • 213
  • 2
    Possible related question: https://stats.stackexchange.com/q/298849/26948 – shimao Aug 24 '17 at 17:39
  • 1
    See https://www.quora.com/Why-is-softmax-activate-function-called-softmax and https://www.quora.com/What-does-the-term-soft-max-mean-in-the-context-of-machine-learning and https://math.stackexchange.com/questions/1888141/why-is-the-softmax-function-called-that-way – Tim Aug 25 '17 at 08:03
  • This should be reopened - it is not a duplicate of the linked question (that is about understanding a smooth approximation of the _max_ function, not the _argmax_ function as softmax is). – brazofuerte Feb 13 '21 at 19:50
  • 1
    https://en.wikipedia.org/wiki/Softmax_function#Smooth_arg_max answers this question. – whuber Oct 25 '21 at 14:22

2 Answers2

3

As discussed on the Mathematics Q&A, Quora, and Wikipedia, softmax is a "soft" version of argmax, rather than maximum. So instead of using max, you should rather call something like which.max (in R) or argmax (in Python/Numpy or Julia) that return the position of the largest value, not the value itself.

Tim
  • 108,699
  • 20
  • 212
  • 390
1

As the other answer suggested, Softmax is a soft version of argmax. Therefore, it will return a vector instead of a scalar.

The additional step, $\text{sofmax}(x)^T x$ make the the final scalar output.

The make the plot similar and see the "soft" surface plot. The code should be

a = seq(-5,5,0.1)
b = seq(-5,5,0.1)

df = expand.grid(a,b)
df$m = apply(df,1,max)
df$sm = apply(df,1,softmax)

softmax <- function(x) {
  p = c(exp(x[1])/(exp(x[1])+exp(x[2])),exp(x[2])/(exp(x[1])+exp(x[2]))) 
  q = c(x[1],x[2])
  p %*% q
}

par(mfrow=c(1,2))

c = matrix(df$m,ncol=sqrt(nrow(df)))
persp(a,b,c)

d = matrix(df$sm,ncol=sqrt(nrow(df)))
persp(a,b,d)

enter image description here

Haitao Du
  • 32,885
  • 17
  • 118
  • 213