2

The blue dot is the (0,0) point.

So there is clearly a reverse relationship between X and Y. but its not exactly linear. the slope is also deeper on the positive side of X.

What kind of mathematical function can I use to transform the plot to fit a linear regression?

I prefer a transformation to a linear relationship, but I am open to some fancy non-linear model.
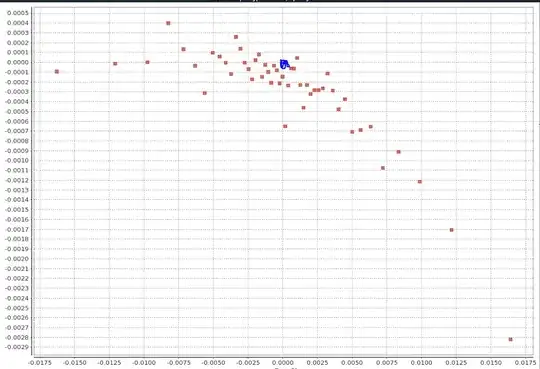
enter image description here

kjetil b halvorsen
  • 63,378
  • 26
  • 142
  • 467
CuriousMind
  • 2,133
  • 5
  • 24
  • 32
  • The point of finding a function is to understand the nature of the system you are observing. Unless you are sure that the deviations (from linear) are a result of errors or some other factor, you shouldn't try to force-fit a linear function to this plot. – Sas3 Aug 24 '17 at 01:48
  • 1
    Although I sympathize with the philosophy in the opening of the comment by @Sas3, I have to (strongly) disagree with the suggestion that one should not attempt to linearize an observed relationship. See https://stats.stackexchange.com/questions/35711 for an effective approach to this problem. Read John Tukey's book *EDA* for a full account. – whuber Aug 24 '17 at 14:41

0 Answers0