19

A random population sample was surveyed. They were asked if they eat vegetarian diet. If they answered yes, they were also asked to specify how long they’ve been eating vegetarian diet without interruption. I want to use this data to calculate average length of adherence to vegetarianism. In other words, when someone becomes vegetarian, I want to know long on average they stay vegetarian. Let’s assume that:

  • All respondents gave correct and accurate responses
  • World is stable: popularity of vegetarianism is not changing, average length of adherence is not changing either.

My reasoning so far

I found it helpful to analyse a toy model of the world, where at the beginning of every year two people become vegetarians. Every time, one of them stays vegetarian for 1 year and another for 3 years. Obviously, the average length of adherence in this world is (1 + 3) / 2 = 2 years. Here is a graph that illustrates the example. Each rectangle represents a period of vegetarianism:

an illustration

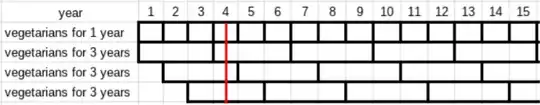
Let’s say we take a survey in the middle of year 4 (red line). We get the following data:

a table

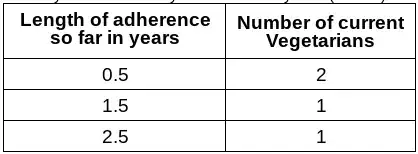
We’d get the same data if we took the survey at any year, starting year 3. If we just average the responses we get:

(2* 0.5 + 1.5 + 2.5)/4 = 1.25

We underestimate because we assume that everyone stopped being vegetarians right after survey, which is obviously incorrect. To obtain an estimate that is closer to the real average times that these participants would remain vegetarian, we can assume that on average, they reported a time about halfway through their period of vegetarianism and multiply reported durations by 2. In a large survey drawing randomly from the population (like the one I’m analysing), I think this is a realistic assumption. At least it’d give a correct expected value. However, if doubling is the only thing we do, we get average of 2.5, which is an overestimate. This is because the longer person stays vegetarian, the more likely (s)he is to be in the sample of current vegetarians.

I then thought that the probability that someone is in the the sample of current vegetarians is proportional to their length of vegetarianism. To account for this bias, I tried to divide number of current vegetarians by their predicted length of adherence:

yet another table

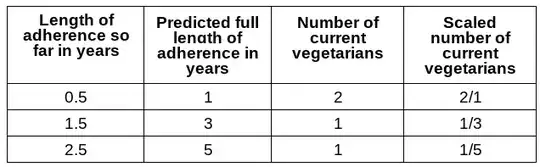
However, this gives an incorrect average as well:

(2*1 + ⅓ * 3 + ⅕ * 5)/(2 + ⅓ + ⅕) = 4 / 2.533333 = 1.579 years

It’d give the correct estimate if number of vegetarians were divided by their correct lengths of adherence:

(1 + ⅓ * (1 + 3 + 5))/(1 + ⅓ * 3) = 2 years

But it doesn't work if I use predicted lengths of adherence and they are all I have in reality. I don’t know what else to try. I read a bit about survival analysis but I’m not sure how to apply it in this case. Ideally, I would also like to be able to calculate a 90% confidence interval. Any tips would be greatly appreciated.

EDIT: It may be possible that the question above has no answer. But there was also another study that asked a random sample of people if they are/were vegetarian and how many times they've been vegetarian in the past. I also know age of everyone in both studies and some other things. Maybe this information can be used in conjunction to the survey of current vegetarians to get the mean somehow. In reality, the study I talked about is just one piece of the puzzle, but a very important one and I want to get more out of it.

  • Getting better data? The following is a vegetarian response, not statistical response. Real vegetarians stayvegetarian for the rest of their life. That I will stayvegeyarian for the rest of my life is about the only thing in the universe that I am absolutely sure about. Meat is the absolutelymost repulsive thing that exists. – kjetil b halvorsen Aug 19 '17 at 19:54
  • 1
    That's not an option atm. This data definitely provides some evidence for length of adherence, I just don't know how to use it. – Saulius Šimčikas Aug 19 '17 at 19:57
  • 1
    At least one of your images appears to have disappeared (403 error when I use the URL). –  Aug 19 '17 at 21:02
  • 2
    @kjetilbhalvorsen For the problem in doesn't matter if vegetarians keep being vegetarians for life. At some point, they will stop being vegetarians, either by eating meat or by dying. – Pere Aug 19 '17 at 22:25
  • @Pere yes, in fact instead of doubling I do `reported length so far + min(life expectancy at respondent’s age, reported length so far)` But let's forget complications for now, I want to first at least solve it for the toy example. – Saulius Šimčikas Aug 19 '17 at 22:34
  • This is a classic problem. I cannot remember the name of it or else I would write a real answer. Maybe this will remind someone else. Many people have been curious about how long something will last given how long it has lasted (e.g., how long will the United States survive given it is about 250 years old?). I remember that the generally accepted answer is that the best estimate is double whatever the current lifespan is. That's an awfully rough estimate though, so for your purposes, that means you can't really get a good estimate given your data (or if you do, you'd be solving an old problem) – le_andrew Aug 19 '17 at 23:03
  • @le_andrew There's more to my problem though. I also have a selection bias, but a very clearly defined one. Still the whole thing does sound like something that should come up quite often and be a classic problem. – Saulius Šimčikas Aug 19 '17 at 23:07
  • 1
    Yes, but that makes it harder, not easier, right? Anyway, your data is right-censored at every data point. I'm not an expert on survival analysis, but I am pretty sure there are no procedures for estimating a survival function for such data other than the more philosophical estimate I mentioned. – le_andrew Aug 19 '17 at 23:16
  • 5
    @kjetil Your "real vegetarians" comment sounds somewhat like a [No True Scotsman](https://en.wikipedia.org/wiki/No_true_Scotsman). The ordinary definition of a vegetarian says nothing about what might happen in the future, nor about why someone is vegetarian, but only about their behavior at the time the attribute is being considered. If someone is vegetarian now, they're vegetarian now, for *whatever* reason they happen to be one. I don't think our personal feelings about the idea of eating meat or the reasons why we might feel was we do is on topic here; they belong somewhere else. – Glen_b Aug 20 '17 at 00:11
  • 1
    For the moment discounting the possibility that someone may return to vegetarianism a second (or subsequent) time, this sounds like a survival problem with censoring, except that of course you only observe the lengths for those that are currently vegetarian -- the ones who were but were but stopped don't have their existence or durations recorded. – Glen_b Aug 20 '17 at 00:20
  • @Glen_b♦ Please see the edit I made at the end of the post. Your last comment made me realise that I have some other information that might be relevant. People who stopped being vegetarian have their existence recorded by other studies. – Saulius Šimčikas Aug 20 '17 at 00:43
  • 1
    Interesting. One issue is we might expect that the average durations of those who aren't vegetarian any more could be shorter than those who still are. – Glen_b Aug 20 '17 at 01:34
  • 2
    Since people who are vegetarians for longer are more likely to be selected to appear in your sample, this means that the probability density function of your sample data is proportional to one minus the cumulative distribution function of the adherence lengths. To make an example out of your example, the distribution of lengths is [0, 0.5, 0, 0.5] (50% last for 1 year, 50% for 3 years), giving a CDF of [0, 0.5, 0.5, 1], with one minus that being [1, 0.5, 0.5, 0] which is proportional to the [2, 1, 1, 0] counts of your sample. – PhiNotPi Aug 20 '17 at 02:36

2 Answers2

12

Let $f_X(x)$ denote the pdf of adherence length $X$ of vegetarianism in the population. Our objective is to estimate $EX=\int_0^\infty x f_X(x)\;dx$.

Assuming that the probability of being included in the survey (the event $S$) is proportional to $X$, the pdf of adherence length $X$ among those included in the survey is $$ f_{X|S}(x) = \frac{xf_X(x)}{\int x f_X(x) dx}=\frac{xf_X(x)}{EX}. \tag{1} $$ At the time of being included in the survey, only a time $Z$ has passed. Conditional on $X$ and $S$, the reported time being a vegetarian is uniform with pdf $$ f_{Z|X=x,S}(z) = \frac1x, \quad \text{for } 0\le z\le x. \tag{2} $$ Elsewhere the density is zero. Hence, using the law of total probability, the overall distribution of time $Z$ passed as vegetarian among those included in the survey becomes \begin{align} f_{Z|S}(z) &= \int_0^\infty f_{Z|X=x,S}(z)f_{X|S}(x)dx \\&= \int_z^\infty \frac1x \frac{xf_X(x)}{EX}dx \\&= \frac{1-F_X(z)}{EX}, \tag{3} \end{align} where $F_X(z)$ is the cdf of $X$. Since $X$ is a positive variable $F_X(0)=P(X\le 0)=0$ and so $f_Z(0)=1/EX$.

This suggests estimating $EX$ by perhaps first estimating $f_{Z|S}(z)$ non-parametrically from the observed data $z_1,z_2,\dots,z_n$. One option is kernel density estimation, using Silverman's reflection method around $z=0$ since the domain of $f_Z(z)$ has a lower bound at $z=0$. This method applied to simulated data is shown as the red curve in the figure below. Having obtained an estimate $\hat f_Z(0)$ of $f_Z(z)$ at $z=0$, an estimate of $EX$ is then given by $\widehat{EX}=1/\hat f_Z(0)$.

This non-parametric method is not ideal however since it does not exploit the fact that $f_{Z|S}(z)$ is a non-increasing function. Also, if $f_X(0)=F_X'(0)>0$, $f_{Z|S}(0)$ may become severely underestimated and $EX$ overestimated. Finding an estimate of $EX$ in such situations without making more assumptions seems difficult, essentially because short adherence times present in this situation hardly show up in the observed data as a result of the biased sampling.

Alternatively, one could make some distributional assumptions about $f_X(x)$ and fit a parametric model by maximising the likelihood $$ L(\theta)=\prod_{i=1}^n \frac{1-F_X(z_i;\theta)}{EX(\theta)} \tag{4} $$ numerically (blue curve in above figure).

R code simulating data and implementing both methods:

# Simulate lognormal duration length in population
set.seed(1)
n <- 1e+4
x <- rlnorm(n,mean=2,sd=.2)
# Biased sampling
y <- sample(x, size=n/10, prob=x, replace=TRUE)
# Duration at time of sampling
z <- runif(length(y),min=0, max=y)
hist(z,prob=TRUE,main="")

# Compute kernel density estimate with reflection aroudn z=0
to <- max(x) + 3
fhat <- density(z,from = -to, to=to)
m <- length(fhat$y)
fhat$y <- fhat$y[(m/2+1):m] + fhat$y[(m/2):1]
fhat$x <- fhat$x[(m/2+1):m]
lines(fhat,col="red")
# Estimate of EX
1/fhat$y[1]
#> [1] 7.032448
# True value (mean of above lognormal)
exp(2+.2^2/2)
#> [1] 7.538325
# Maximum likelihood
nll <- function(theta, z) {
  - sum(plnorm(z, theta[1], theta[2], log.p=TRUE, lower.tail = FALSE)) + length(z)*(theta[1] + theta[2]^2/2)
}
fit <- optim(c(0,1),nll,z=z)
fit$par
#> [1] 1.9860464 0.2019859
EXhat <- exp(fit$par[1]+fit$par[2]^2/2) # MLE of EX
EXhat
#> [1] 7.436836
curve(plnorm(z, fit$par[1], fit$par[2], lower.tail=FALSE)/EXhat, xname="z", col="blue",add=TRUE)
Jarle Tufto
  • 7,989
  • 1
  • 20
  • 36
  • 2
    Hey, thank you very much for answering, I haven't yet took the time to understand everything, just wanted to add that I do know general distribution from that another study. (the only problem with the other study it that it made people choose between options for how long they've been vegetarian and one of the options was "More than 10 years" and the average depends almost entirely on how much longer than 10 years people remain vegetarian) – Saulius Šimčikas Aug 20 '17 at 12:47
  • Ok, I hope there are no major flaws in my reasoning. I see that @PhiNotPi arrive at the same pdf in his comment to the OP. – Jarle Tufto Aug 20 '17 at 13:06
  • @Saulius If your have access to the second right censored data set and the underlying distributions indeed can be assumed to be identical, then the ideal solution would be to combine the likelihood for that data set (which is straightforward to write down if it is just some right censored sampling) and then maximise the joint likelihood. – Jarle Tufto Aug 20 '17 at 13:29
  • that one is not right censored: http://imgur.com/U8ofZ3A I now realise that I had to mention this at the start but I thought that my problem had some more straightforward solution... – Saulius Šimčikas Aug 20 '17 at 13:39
  • @Saulius Those data are interval censored. Again, it is straightforward to compute the likelihood. – Jarle Tufto Aug 20 '17 at 13:44
  • I didn't see how your model accounts for a second form of censoring: namely, not asking people who are currently non-vegetarian *whether they had ever been vegetarian in the past.* It seems to me this failure of the survey could introduce a large, inestimable, systematic bias in the responses. In particular, it would imply the probability of being included in the survey is $X$ *or greater*--the greater possibility corresponding to people with interrupted periods of vegetarianism. (Imagine the religiously faithful who respond "oh yes, if it's Friday or Lent then I'm a vegetarian...") – whuber Aug 20 '17 at 21:15
  • @whuber I'm not entirely sure but I think everything is ok as long as $X$ is defined as the length of a randomly chosen period of vegetarianism, that is, we are sampling from a population of such periods where each member of the population (that is, such periods) may be within the same individual. Repeated short periods would then appear more frequently in the sample not because of biased sampling but because short periods are indeed more frequent. – Jarle Tufto Aug 21 '17 at 11:23
  • @whuber If instead defining $X$ as being generated by first choosing an individual at random from the population of individuals that are vegetarian some time during their life span and then choosing a random period of vegetarianism from that individual, that would be something else. – Jarle Tufto Aug 21 '17 at 11:23
  • @JarleTufto I tried to replicate your method with exponentially distributed data, and it seems there is systematic bias towards 1 in the estimated parameter (rate) by parametric approach. FYI for my log likelihood, I've used: `- sum(pexp(z, theta, log.p=TRUE, lower.tail=FALSE)) + length(z)*(1/theta)` (there is only one `theta`) – jessexknight Dec 08 '21 at 23:21
  • @jessexknight If you find substantial bias even for large sample sizes, that suggests an error. I don't think you have taken the log of the denominator in the above expression for $L(\theta)$ correctly, for the exponential model you consider where $\theta$ is the rate parameter you should obtain something like `-sum(pexp(z, theta, log.p=TRUE, lower.tail=FALSE)) - length(z)*log(theta)`. – Jarle Tufto Dec 09 '21 at 08:54
  • Yes sorry I see that now... To avoid making such silly mistakes, I switched to the [distrEx](https://cran.r-project.org/web/packages/distrEx/index.html) package, and evaluate the likelihood for any distribution `distr` like `prod(distr@p(z,lower.tail=F)) / E(distr)`, or the log-likelihood like `sum(distr@p(z,lower.tail=F,log.p=T) - log(E(distr)))`. Now I find that (interestingly), I can estimate theta correctly with the likelihood, but I get substantial bias (error) when using the log-likelihood, mainly affecting heavily skew distributions like `Exp`. – jessexknight Dec 09 '21 at 16:57
  • In fact, I find in every case so far that $EX = \frac{1}{2} EZ$ ! Is this reasonable? Perhaps it can be proven ... – jessexknight Dec 09 '21 at 17:20
  • @jessexknight Yes, sure, it follows from (2) that $E(Z|X)=X/2$ and so by the law of total expectation, $EZ=EE(Z|X)=EX/2$ (I suppose that is what you mean?) – Jarle Tufto Dec 09 '21 at 17:52
  • Yes, well, happy that you could see it so easily - I could not. Is this not a piece of high-yield information to answer the OP question? "How to calculate average length of adherence to vegetarianism when we only have survey data about current vegetarians" -- the extremely simple answer: "double the mean reported duration" – jessexknight Dec 09 '21 at 18:05
  • @jessexknight Thanks, yes, you're right $EX$ can indeed be estimated $2\bar Z$! – Jarle Tufto Dec 09 '21 at 18:20
  • Thank you @JarleTufto! Would you consider editing your answer to include this information? An analogy I found helpful was estimating life expectancy from asking people their current age. – jessexknight Dec 09 '21 at 18:46
  • @jessexknight Thinking a bit more carefully about this and doing some more simulations, it is not the case that $EZ=EX/2$, this would only hold conditional on $S$, that is, we have $E(Z|S)=E(X|S)/2$. So estimating $EX$ (the unconditional expectation) by $2\bar Z$ would not work. – Jarle Tufto Dec 10 '21 at 10:54
0

(I've dithered over adding this, as it appears @JarleTufto has already given a nice mathematical approach; However I'm not clever enough to understand his answer, and now I'm curious if it is exactly the same approach, or if the approach I describe below ever has its uses.)

What I would do is guess an average length, and guess a few distributions around it, and then, for each, make a simulation of my population, and sample it regularly.

You said to assume the total population of vegetarians is not changing, so each time my model has someone stopping, a brand new vegetarian is created. We need to run the model for a number of simulated years to make sure it has settled down, before we can start to sample. After that I think you can take samples every simulated month (*) until you have enough to form your 90% confidence interval.

*: or whatever resolution works with your data. If people gave their answer to the nearest year, sampling every 6 months is good enough.

Out of all your guesses, you choose the mean and distribution which (averaged over all the samples you took) gives you the closest result to what your real-life survey gave.

I would iterate my guesses a few times, to narrow in on the best match.

The best distribution may not be single-peaked. The ex-vegetarians I personally can think of stopped because of major lifestyle changes (typically marrying/living with a non-vegetarian, or moving country, or falling seriously ill and a doctor suggesting it might be diet); on the other side is the power of habit: the longer you've been a vegetarian the more likely you are to carry on being one. If your data had asked age and relationship status, we could throw that in the above simulation too.

Darren Cook
  • 1,772
  • 1
  • 12
  • 26