2

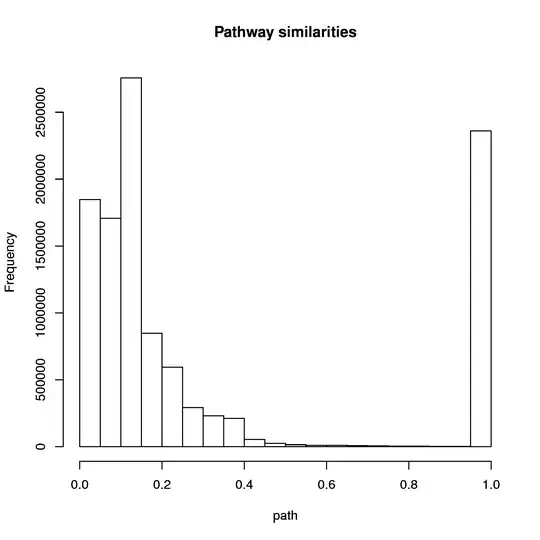
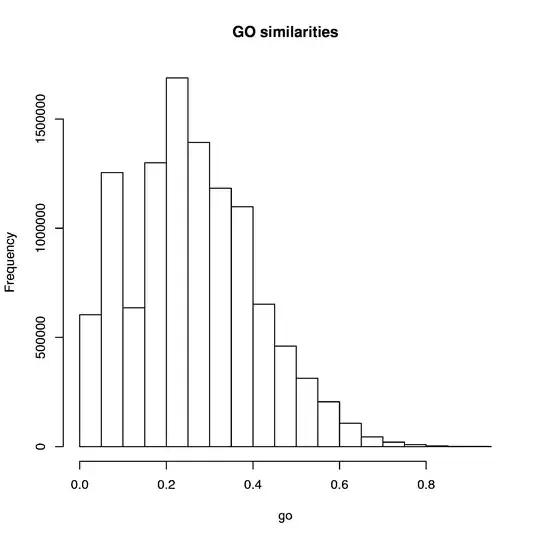
I calculate/measure two related variables $X$ and $Y$. Both of them are bounded between $[0, 1]$ (they are not probabilities though) and aren't uniformly distributed (neither randomly) as the values tend to be closer to 0.

accumulative distribution of X accumulative distribution of Y

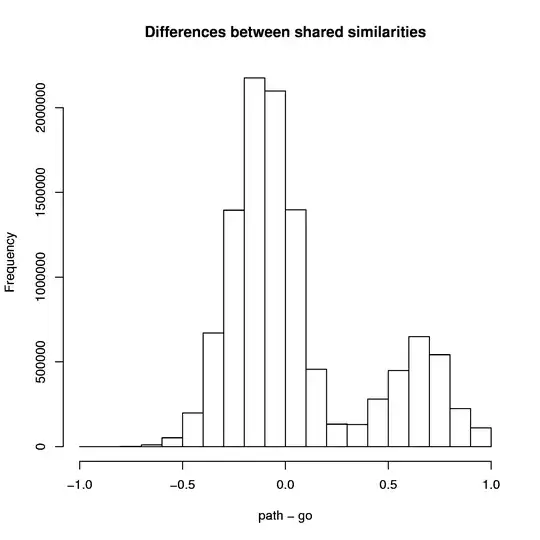
However when I subtract one variable to the other ($X-Y = Z$), $Z$ follows a normal like distribution where $\bar{z}\approx0$ and $\sigma² \approx 0.25$. It is of course bounded between $[-1, 1]$.

distribution of Z

Surprisingly the resulting variable is centered and bell shaped. I think that there might be a reason behind it. The central limit theorem was one of the first things that came to my mind.

What can be the causes of such distribution is reached?

Note: The images are not with updated data, so they don't show as clearly the effect I describe in the question, but let's assume that.
llrs
  • 525
  • 5
  • 25
  • 3
    I'd check out beta distributions here as reference distributions, not the normal. I can't see that the central limit theorem is relevant for the reason you give. You have bounded distributions so their difference in turn is bounded. Your modes are near 1 so it is not surprising that the mode of the difference is near 0 (although not inevitable). The rest is empirical, I guess. – Nick Cox Aug 19 '17 at 11:23
  • 1
    When $X$ and $Y$ have the same distribution on $[0,1]$ and it's unimodal, then the distribution of $X-Y$ is going to look remarkably like a bell shape. *Of course* it will be centered, because the distributions of $X-Y$ and $Y-X$ are the same. – whuber Aug 19 '17 at 14:16
  • @Nick, I updated questions with images of the data I had. I was mistaken and the data is closer to 0 than I thought. – llrs Aug 19 '17 at 14:44
  • So, similarity is measured on a scale from 0 to 1 for different situations. Pathway similarity is clearly bimodal which may be part of the explanation for the bimodaiity of the difference distributions I am not clear what you are asking now, but beta distributions are some distance from your data given the bimodality. It's a dark but simple truth that many empirical distributions are some distance from named distributions in the textbooks, although some interesting science often comes from working out why that is. – Nick Cox Aug 19 '17 at 17:23
  • Why not look at the scatter plot of your two measures, as difference is defined by $y - x$? You'll need one of more transparency, binning, smoothing to make sense of a scatter plot with millions of data points, but in principle it carries all the information you have. – Nick Cox Aug 19 '17 at 17:24
  • Check [non-standard beta distribution](https://stats.stackexchange.com/questions/186465/difference-between-standard-beta-and-unstandard-beta-distributions/186467#186467) – Tim Aug 19 '17 at 19:03

1 Answers1

0

If you have 2 uniformly distributed (on $(0,1)$) random variables and you take their difference the resulting random variable will be a triangular distribution. The peak point (mode) will be at $0$ and the density will be linearly increasing on $(-1,0)$ and linearly decreasing on $(0,1)$. A normal distribution would be a reasonable approximation of the sample mean of several of these observations. However, for a single measurement the exact distribution (triangular) is likely to be better.

This assumes your two initial measurements are uniform on $(0,1)$ deviations from this might change the distribution from triangular. If the distributions differ from uniform, you can always use simulation to get an empirical distribution.

Lucas Roberts
  • 3,819
  • 16
  • 45