8

My confusion stems from reading the following paper

http://www.bmj.com/content/351/bmj.h3868

It states in its abstract (and they later show an empirical study that conforms to the claim) - "Overfitted models tend to underestimate the probability of an event in low risk patients and overestimate it in high risk patients"

I'm confused with regards to the generality of this statement. I've seen many cartoons/figures depicting overfitting as a model modelling/capturing noise, and it isn't intuitively obvious to me how that noise would necessarily lead to overestimates of risk in high risk and underestimates of risk in low risk patients. Why can't an overfitted model capture noise in a way that it underestimates the risk in high risk patients? Is there a mathematic proof for their statement?

For the second part of my question, I would like to ask, if the claim they make is true, would calibration plots of underfitted models go the other way (slope<1 for observed v/s predicted; underestimating high risk risks, and overestimating low risk risks?). Again I can't intuitively predict why a simpler underfitting model would necessarily generate a predictable calibration curve.
kjetil b halvorsen
  • 63,378
  • 26
  • 142
  • 467
  • 1
    The statement seems dubious to me. What about models that are approximately unbiased but just have very high variance? – Jake Westfall Aug 26 '17 at 17:09
  • 3
    The statement sounds right to me. That's what overfitting is in a binary context. Consider that you have maximum uncertainty when your guess is .5, & maximum certainty if your guess is 1.0 or 0.0. The ideal fit would be when your guess is equal to the true probability. So overfitting is guesses closer to 0 for observed 0's where the true probability is not 0, and closer to 1 for observed 1's where the true probability is not 1. Conversely, underfitting is guesses closer to .5. – gung - Reinstate Monica Mar 28 '18 at 14:33
  • @gung-ReinstateMonica Would you want to expand on that in an answer? (Even on its own, it could be an answer.) – Dave Feb 23 '22 at 13:10
  • Sorry, @Dave, I haven't had a chance to get to this. – gung - Reinstate Monica Mar 03 '22 at 20:57

1 Answers1

1

it isn't intuitively obvious to me how that noise would necessarily lead to overestimates of risk in high risk and underestimates of risk in low risk patients.

It does not "necessarily", but it "tends" to:

Overfitted models tend to [...]

Why can't an overfitted model capture noise in a way that it underestimates the risk in high risk patients?

It can, and occasionally it does. But it doesn't do it and cannot do it systematically. If it did, it wouldn't be overfitted, but underfitted. It would systematically give lower estimates (i.e. higher uncertainty, as @gung said it his/her comment) than the optimal model.

Fitting a function to the data means minimising some error measure. The more free parameters (coefficients) the function has, the better it can approximate the empirical data and, consequently, reduce the error.

Now, for low risk patients, we'll $-$ on average! $-$ have more non-events, and an overfitted model will better approach the non-event level (e.g. zero), as it attempts to minimise the error. Occasionally, we will encounter an event even for low-risk patients, and our overfitted model will likely pick that noise too, but, due to its flexibility (being overfitted) will rapidly return to zero as we move away from that observation. The mirror-image happens for high-risk patients: There are more events than non-events there and the overfitted model will try to approximate these.

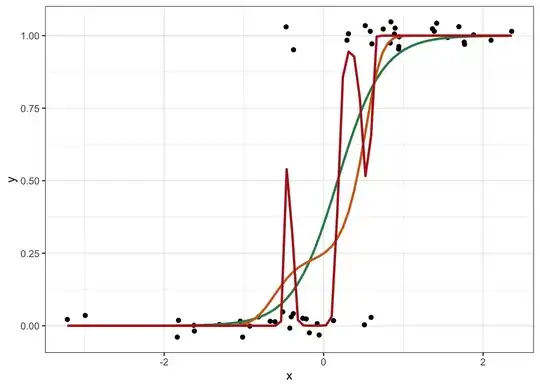
To give you some intuition, observe the following artificial dataset and the fitted probabilities:

overfitting example

(two normally distributed classes, fitted by simple logistic regression (green), logistic regression with poly(x, 3) predictors (orange) and with poly(x, 5) predictors (red))

As you can see, the severely overfitted red curve is, for $x < 0$ almost constantly below the green (optimal) one, except for one single peak around $x = -0.5$, where it picked up the noise on the "event" side. For "high risk patients" it's the opposite: The red curve is almost always above the green one, except again for some noise around $x = +0.5$.

Igor F.
  • 6,004
  • 1
  • 16
  • 41