9

When using the forward stepwise approach to select variables, is the end model guaranteed to have the highest possible $R^2$? Said another way, does the stepwise approach guarantee a global optimum or only a local optimum?

As an example, if I have 10 variables to select from and want to build a 5-variable model, will the end result 5-variable model built by the stepwise approach have the highest $R^2$ of all possible 5-variable models that could have been built?

Note that this question is purely theoretical, i.e. we are not debating whether a high $R^2$ value is optimal, whether it leads to overfit, etc.

zabidlo
  • 93
  • 1
  • 1
  • 4
  • 2
    I think stepwise selection is going to give you the highest possible $R^2$ in the sense that it will be biased to be much higher than the true model (that is, it will *not* result in the optimal model). You may want to read [this](http://stats.stackexchange.com/questions/20836/algorithms-for-automatic-model-selection/20856#20856). – gung - Reinstate Monica Jun 05 '12 at 21:21
  • 11
    A maximum $R^2$ is attained when *all* variables are included. This is clearly the case because including a new variable cannot decrease $R^2$. Indeed, in what sense do you mean "local" and "global"? Variable selection is a discrete problem--choose one out of $2^k$ subsets of $k$ variables--so what would a local neighborhood of a subset be? – whuber Jun 05 '12 at 21:30
  • Re the edit: Could you please describe the "stepwise approach" you have in mind? (The [ones I am familiar with](http://en.wikipedia.org/wiki/Stepwise_regression) do not arrive at a specified number of variables: part of their purpose is to help you decide how many variables to use.) – whuber Jun 05 '12 at 21:50
  • Do you think that a higher (raw) $R^2$ is a good thing? That's why they have adjusted $R^2$, AIC, etc. – Wayne Jun 06 '12 at 17:38
  • 2
    For maximum R2, include all 2-way and 3-way interactions, various transformations (log, inverse, square, etc.), phases of the moon, etc. – Zach Jun 07 '12 at 19:52

3 Answers3

15

Here is a counter example using randomly generated data and R:

library(MASS)
library(leaps)

v <- matrix(0.9,11,11)
diag(v) <- 1

set.seed(15)
mydat <- mvrnorm(100, rep(0,11), v)
mydf <- as.data.frame( mydat )

fit1 <- lm( V1 ~ 1, data=mydf )
fit2 <- lm( V1 ~ ., data=mydf )

fit <- step( fit1, formula(fit2), direction='forward' )
summary(fit)$r.squared

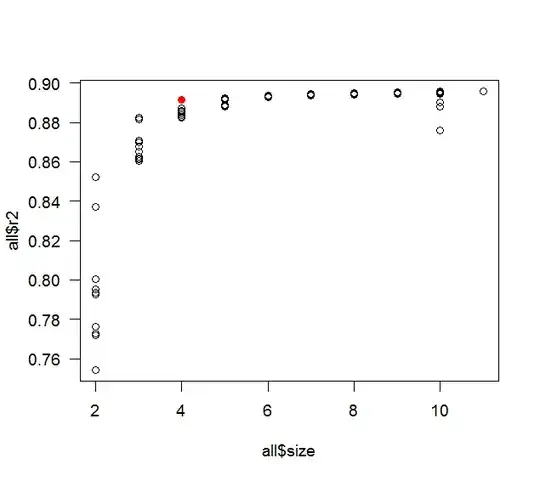
all <- leaps(mydat[,-1], mydat[,1], method='r2')
max(all$r2[ all$size==length(coef(fit)) ])

plot( all$size, all$r2 )
points( length(coef(fit)), summary(fit)$r.squared, col='red' )

R2

whuber wanted the thought process: it is mostly a contrast between curiosity and laziness. The original post talked about having 10 predictor variables, so that is what I used. The 0.9 correlation was a nice round number with a fairly high correlation, but not too high (if it is too high then stepwise would most likely only pick up 1 or 2 predictors), I figured the best chance of finding a counter example would include a fair amount of collinearity. A more realistic example would have had various different correlations (but still a fair amount of collinearity) and a defined relationship between the predictors (or a subset of them) and the response variable. The sample size of 100 was also the 1st I tried as a nice round number (and the rule of thumb says you should have at least 10 observations per predictor). I tried the code above with seeds 1 and 2, then wrapped the whole thing in a loop and had it try different seeds sequentially. Actually it stopped at seed 3, but the difference in $R^2$ was in the 15th decimal point, so I figured that was more likely round-off error and restarted it with the comparison first rounding to 5 digits. I was pleasantly surprised that it found a difference as soon as 15. If it had not found a counter example in a reasonable amount of time I would have started tweaking things (the correlation, the sample size, etc.).

COOLSerdash
  • 25,317
  • 8
  • 73
  • 123
Greg Snow
  • 46,563
  • 2
  • 90
  • 159
  • 3
    +1 Well done! Examples are much more convincing then invoking hypothetical possibilities. But if you ever get a chance, please consider sharing the thought process you went through in constructing this counterexample. – whuber Jun 07 '12 at 19:54
  • 1
    Your account of the procedure is invaluable: this is the sort of revealing, practical stuff that shows up only in the most lucid papers, if at all, and otherwise has to be learned directly from others or re-invented. (I wish I could add another upvote.) – whuber Jun 08 '12 at 19:49
5

You will not necessarily get the highest R$^2$ because you only compare a subset of possible models and may miss the one with the highest R$^2$ which would include all the variables.. To get that model you would need to look at all subsets. But the best model may not be the one with the highest R$^2$ because it may be that you over fit because it includes all the variables.

Michael R. Chernick
  • 39,640
  • 28
  • 74
  • 143
  • 1
    I believe this too, but to be convincing--because you have not provided a rigorous argument--it would be very nice to see an actual example. It would be even nicer to understand why a stepwise procedure converging to $k$ variables (say) might fail to converge to the highest-$R^2$ combination of $k$ variables (which would not require searching *all* subsets). – whuber Jun 06 '12 at 13:20
  • Stepwise procedrues depend on where you start. If you start with two different initial sets of variables it could lead you to different solutions. The point is that at each step there is a criterion on the F statistic for a variable to enter and als for a variable to leave. The F statistic depends on the variables that are currently in the model. The procedure stops when neither the F to enter nor the F to exit are statistically significant at the specified threshold. So that easily could happen before you add all the variables to the model. – Michael R. Chernick Jun 06 '12 at 15:59
  • This could easily be demonstrated with an example say in SAS with the output pasted into the answer. – Michael R. Chernick Jun 06 '12 at 15:59
  • 1
    I agree--but finding the counterexample is the hard part, @Michael, not using the software! – whuber Jun 06 '12 at 16:48
  • Either way it is a lot of work! – Michael R. Chernick Jun 06 '12 at 16:52
4

If you really want to get the highest $R^2$ you have to look (as @Michael said) at all subsets. With a lot of variables, that's sometimes not feasible, and there are methods for getting close without testing every subset. One method is called (IIRC) "leaps and bounds" and is in the R package leaps.

However, this will yield very biased results. p-values will be too low, coefficients biased away from 0, standard errors too small; and all by amounts that are impossible to estimate properly.

Stepwise selection also has this problem.

I strongly recommend against any automated variable selection method, because the worst thing about them is they stop you from thinking; or, to put it another way, a data analyst who uses automated methods is telling his/her boss to pay him/her less.

If you must use an automated method, then you should separate your data into training and test sets, or possibly training, validating, and final sets.

Scortchi - Reinstate Monica
  • 27,560
  • 8
  • 81
  • 248
Peter Flom
  • 94,055
  • 35
  • 143
  • 276
  • 1
    stepwise selection is not as bad as you make out if the purpose is for prediction, or for using the sequence of models produced. in fact many rj mcmc algorithms for model selection are basically "random stepwise" as the proposals usually consist of adding or removing one variable. – probabilityislogic Jun 06 '12 at 07:44
  • i think stepwise is in a similar class to p values - generally ok but ritually used in a poor way. – probabilityislogic Jun 06 '12 at 07:46
  • 1
    Stepwise has been shown to be horrid. For details, see Frank Harrell's book Regression Modeling Strategies. What is RJ? It's true that the sequence of models may say something useful, but then what? I also have lots of problems with p-values, but that's another issue (or see The Cult of Significance Testing) – Peter Flom Jun 06 '12 at 10:59
  • The leaps algorithm is an exact method, not an approximation. – cardinal Jun 06 '12 at 17:45
  • 1
    @PeterFlom - RJ is reversible jump. stepwise is simply a fast way to search the model space, making the problem less prone to combinatorical explosion. But it needs "multiple restarts" to help avoid it getting stuck in a local mode. I'll have to get this book I think though. – probabilityislogic Jun 06 '12 at 20:15
  • If you're not directly interpreting the coefficient estimates/$p$-values, then what you've pointed out is not problematic. An important example is when you're tuning the model to produce optimal prediction - the only thing interpreted is the prediction accuracy. Often times this tuning is best done automatically, since you're searching a large space and it's not a problem if the model is a "black box". So, I'm not so sure a sweeping statement like "I strongly recommend against any automated variable selection method" is very appropriate without some better understanding of the context. – Macro Jun 08 '12 at 02:30
  • Also, I could very well be wrong here but I'm having trouble seeing how any kind of variable selection could produce these effects if the predictors are orthogonal (and if the predictors are not orthogonal you have problems regardless of whether or not you're doing variable selection). In that case (assuming linear regression), the p-values are independent random variables. Similarly, the coefficient estimates are independent random variables. So, they will be the same regardless of what other variables are in the model. How could the variable selection produce bias? Am I missing something? – Macro Jun 08 '12 at 02:39
  • I did a paper (with David Cassell) on simulated and orthogonal data where these effects were apparent. For the math background, see @FrankHarrell's book Regression Modeling Strategies. Or you can Google "Cassell" and "stepwise" and find lots of stuff. But Frank's book is the most complete. – Peter Flom Jun 08 '12 at 10:21
  • I've seen you make this remark in several of your answers but have never heard an explanation of _why_ it is true when the predictors are orthogonal. I'm only looking for some intuition here. – Macro Jun 08 '12 at 17:25
  • 2
    @Macro, Even in the orthogonal case, you see why the (naive) $p$-values would be off, correct? You also see why $|\hat\beta|$ of the "selected" model would tend to be (i.e., stochastically) larger than in the unselected case, correct? Say you had just two orthogonal variables, both $\beta_i = 0$, and your model selection was to choose the one with the lower $p$-value to keep (same as choosing the one of largest magnitude). – cardinal Jun 08 '12 at 19:04
  • 1
    @cardinal, I see. So this basically just a result of the fact that when you have an iid sample $X_1, ..., X_n$, then $$E(\min\{X_1, ..., X_n \}) < E(X_1)$$ if I'm understanding you correctly. That makes sense. – Macro Jun 08 '12 at 19:59