0

I created one simple regression model for predicting the amount of loan that needs to be given to a particular individual. I plotted the residual plots to understand the underlying assumptions in the regression. However, I'm not too sure how should I interpret the graph. Could someone please help.

The graph was created using the below code.

sns.residplot(y_train_preds,y_train_preds- y_train)
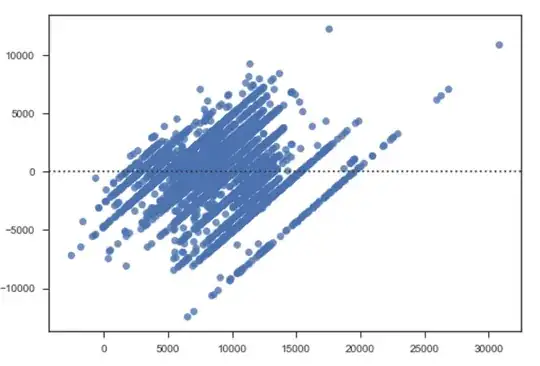
Attaching screenshot.enter image description here

user4943236
  • 101
  • 4
  • We will need more information about your data and model to interpret this. – mkt Aug 06 '17 at 07:50
  • 1
    1. You're plotting the *negative* of the residuals against fitted? Why? 2. DIscreteness of y-values (or at least y's concentrated at a few specific values) accounts for the banded appearance. – Glen_b Aug 06 '17 at 08:07
  • @mkt, may I know what information is required and I'll add it here. – user4943236 Aug 06 '17 at 08:28
  • @Glen_b are you suggesting `sns.residplot(y_train_preds, y_train-y_train_preds)` – user4943236 Aug 06 '17 at 08:29
  • 2
    That would be the more typical thing to do in statistics (to plot $y_i-\hat{y}_i$ vs $\hat{y}_i$), yes so statisticians will generally be more used to reading a plot done that way around. – Glen_b Aug 06 '17 at 08:30
  • The residuals should be calculated as predicted minus observed and not the other way around. – g3o2 Aug 06 '17 at 22:07

0 Answers0