I am trying to replicate a cryptoanalysis technique called template attack. I won't enter in details of the attack itself, but the theory behind involves multivariate distribution (more details here).
So, I tried to come up with some small code in R to perform the analysis, but I got stuck on the multivariate part of the solution. I've been failing on computing the pdf of an example dataset. I'll add the code below.
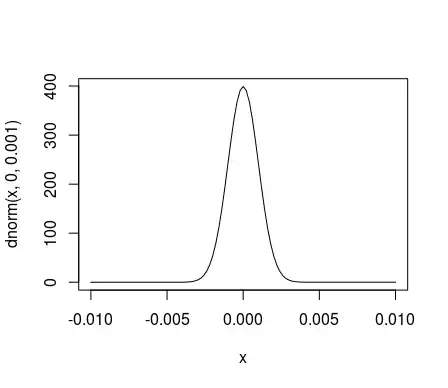
Basically, in the code, I build the covariance matrix using 5 random variables with 50 values each. Then I compute the probability for a new random variable. My general doubt is why am I getting infinite (sometimes) or very high probabilities? I would like to get probabilities between 0 and 1. Is my code correct? Which probability should I get if I compute the pdf using one of the random variables of the covariance matrix? I guess it should be 1, right?
A couple of things I've been noticing. if I increase the value of the variable deviation I get "better" probabilities (that is, probabilities that will be between 0 and 1). My real data will have at least 100 variables and more than 1000 values each and variation of the data is very small (so, I'll likely get only infinite values for probability).
By the way, I know that a pdf can have values greater than 1, but I was expecting that in rare cases not always.
Code:
# Dataset setup
sample_size <-5;
deviation <- 0.005;
traces <- 50;

# Traces vectors
bv <- matrix (rep(0,(sample_size*traces)), sample_size, traces);
for (i in 1:(sample_size)) {
    bv[i,] <- runif((traces), (i-deviation), (i+deviation));
}

# Covariance matrix computation
m <- matrix (rep(0, (sample_size*sample_size)), sample_size, sample_size);
for (i in 1:(sample_size)) {
    for (j in 1:(sample_size)) {
        m[i, j] <- cov(bv[i,], bv[j,]);
    }
}


# Testing sample vector
vt <- rep(0,sample_size)
for (i in 1:(sample_size)) {
    # Set testing vector as one of the trace vectors
    #vt[i] <- bv[i,1] - mean(bv[i,]);
    # Set a random testing vector
    vt[i] <- runif(1, i-0.00200, i+0.00200) - mean(bv[i,]);
}

# Compute the pdf
exp((-1/2)*t(as.matrix(vt))%*%solve(m)%*%as.matrix(vt) - 0.5*sample_size*log(44/7) - 0.5*log(det(m)))
