2

I have a small sample of marks obtained by a group of students and I would like to apply a binomial test to check if more than half of the size of the classroom has failed due to the application of a new technique for teaching music named X. My data is in vigesimal format and is the following:

data1=c(11,4,6,2,11,7,1,9,1,13,1,13,10,7,10,12,13,4,1,14,1,9,1,10,4)
data2=c(10,4,10,5,15,10,17,15,15,11,14,9,12,15,15,10,8,3,12)

The first set of data followed the course by using this new technique, while in the second set are those students that follow the traditional methodology. In this system, a mark of 11 or greater is considered for passing the course.

I have applied hist() and qqnorm() from R and I have the suspicion that the data is not normally distributed.

When I was checking about hypothesis testing I have been reading about the bootstrapping technique for small samples in:

http://www.stat.ucla.edu/~rgould/110as02/bshypothesis.pdf

The question that I have is how can I apply bootstrapping by using R to check it up if my hypothesis holds or not. I mean that the new methodology will make more students to fail the subject. Also, I have read about the possibility of doing permutation tests due to the limitations of bootstrapping, but I am really a newbie in the field of statistics.

Any help?
Tim
  • 108,699
  • 20
  • 212
  • 390
Layla
  • 569
  • 1
  • 5
  • 16
  • The bootstrap is a large sample technique, not a small-sample technique – Michael M Aug 02 '17 at 09:19
  • @MichaelM there is no reason why permutation test should not be used on relatively small sample. – Tim Aug 02 '17 at 19:28
  • Agreed. A permutation test is often the way to go (+1 to your answer). – Michael M Aug 02 '17 at 20:09
  • Does my answer help? If something is unclear, feel free to comment. – Tim Aug 04 '17 at 14:47
  • @Tim thank you very much for your answer. I have one question, in this case, we could say that the new methodology for teaching was the "reason" why the students failed in more quantity than the group that did not apply the new methodology? Silly question, but with the value of p=0.08 should I not compare it with a significance value alpha such as in p-test hypothesis testing? – Layla Aug 09 '17 at 03:25
  • 1
    @Layla this kind of analysis only shows you that there is a difference and gives you the probability of such thing happening by chance. You *cannot* deduce causality from such result, [correlation does not imply causation](https://en.wikipedia.org/wiki/Correlation_does_not_imply_causation). As about p threshold, [the 0.05 etc levels are *arbitrary*](https://stats.stackexchange.com/questions/55691/regarding-p-values-why-1-and-5-why-not-6-or-10) -- your sample is small and it is up to you if you find such value convincing (I'd personally say that it is not that bad given the small sample). – Tim Aug 09 '17 at 08:25
  • @Tim one last question, about the book you recommend me; could you put a list of other books that could help for a newbie in statistics like me? I would like to focus on bayesian statistics and not the frequentist one. Thanks – Layla Aug 11 '17 at 00:42
  • Do you have anything specific in mind? You can find some of my recommendations [in those answers](https://stats.stackexchange.com/search?q=user%3A35989+%5Bbooks%5D+is%3Aanswer). As about books on Bayesian inference, check [those threads](https://stats.stackexchange.com/search?q=%5Bbooks%5D+%5Bbayesian%5D) (you can start with books by Gelman, "Data analysis" by Skilling, Kruschke's handbook, "Bayesian essentials" by Robert, plus his books on MCMC) – Tim Aug 11 '17 at 06:54

1 Answers1

3

Actually, this is a classical scenario to use a permutation test. When using permutation tests, we randomly re-assign the group labels to simulate the "null distribution" (how would your data look like if the group labels were absolutely random). As I understand your question, you have two groups $A$ and $B$, each of the groups took the test, where they passed if their score was at least 11. You want to test the hypothesis that the new method of learning has lead to improvement in test scores, i.e. the proportion of passed exams is greater in group $B$ as compared to $A$.

First, let's change format of your data:

data <- c(data1, data2)
groups <- c(rep("A", length(data1)), rep("B", length(data2)))

Next, let's check the descriptive statistics:

tapply(data, groups, function(y) mean(y >= 11))
##         A         B 
## 0.2800000 0.5263158 

We can see that the proportion of passed tests is greater in group $B$, but is this a significant difference? To check this, let's first define the test statistic:

test <- function(x) diff(tapply(x, groups, function(y) mean(y >= 11)))

We want to look at the difference between proportion of passed exams in group $B$, ($p_B$) and in group $A$ ($p_A$), since $p_B > p_A$ is the same as saying that $p_B - p_A > 0$. So now we can run the simulation:

set.seed(123) # we set the seed for the result to be replicable
res <- replicate(5000, test(sample(data)))

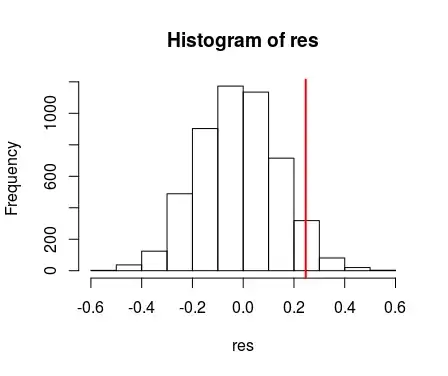
and look at the histogram (the actual result is marked using the red line):

enter image description here

and we check the probabilities

mean(test(data) > res)
## [1] 0.9156

What the test tells us is that in 92% of the cases the actual difference was greater then the differences seen in the "null" data (i.e. data with random labels). So in 92% of cases the results were less extreme then in your case, or saying it differently, if the group labels would be totally random, we could see such results only 8% of the time. So clearly, it made a difference if you were in the "new teaching method" group, or not with $p = 0.08$.

If you want an introductory text that discusses such methods while giving examples (with R code), you can check the following book:

Phillip I. Good . (2013). Introduction to Statistics Through Resampling Methods and R. Wiley.

Tim
  • 108,699
  • 20
  • 212
  • 390