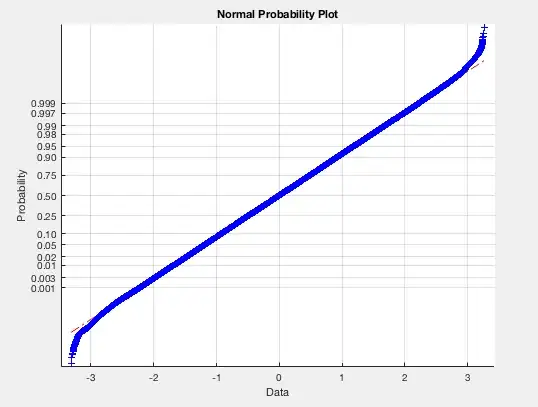
I am not well acquainted enough to judge this well. This plot was obtained from normplot in Matlab. There is a good linear fit although the tails are concerning. Does my data follow a normal distribution, judging from this?
Asked
Active
Viewed 210 times
1
-
Yes that's a good fit, if you look at the example in the help file the tails on the probplot just do that. It's worrisome if they are on the opposite side of the line. – Dave Dec 05 '18 at 19:39
-
This looks very consistent with the sample being drawn from a normal distribution. Though the tails do not match perfectly, this is within a tolerable range. – Noah Jul 27 '17 at 22:44
-
1Tolerable range for what purpose? If I'm using the normal distribution to estimate $P(X>\mu+3.5\sigma)$ it looks like I would greatly overestimate the actual probability. If I was trying to build a CI for the mean it might be fine but the OP doesn't state they're doing anything of the kind. – Glen_b Jul 28 '17 at 02:22
-
Good point. I was presuming the latter. – Noah Jul 28 '17 at 18:59
-
@Dave, the tails are on opposite sides of the line. – gung - Reinstate Monica Dec 05 '18 at 19:55
