-1

I'm currently working on sales forecasting. I'm using a Regression Forest to make my forecast. (with MLLib from Spark on Databricks) I'm trying to find what features are useful in my forecasting. Something disturbs me, the standard deviation (STDDEV) of my prediction is really low. For a period of 65 working days to predict :

  • STDDEV Real Data = 79 MV = 403 (Max Value) ; STDDEV Prediction = 50 MV = 253
  • STDDEV Real Data = 88 MV = 492 ; STTDEV Prediction = 39 MV = 225
  • STDDEV Real Data = 58 MV = 268 ; STTDEV Prediction = 27 MV = 137

I'm always using the same parameters for my forest :

  • .setNumTrees(60) .setMaxDepth(25) .setMaxBins(100)

In any cases, my max values of my prediction is smaller.

Is there a way to increase this Standard deviation for my predictions ? Should I add more features ? Should I try to changer the numTrees and maxDepth ?
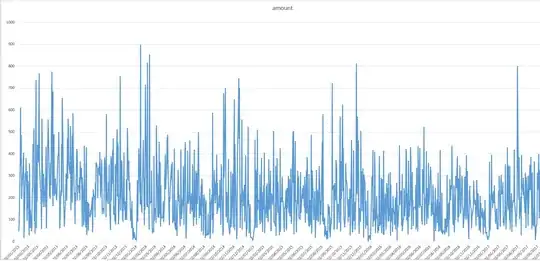
A chart of my data for one product : enter image description here

KIToRe
  • 15
  • 4
  • 1
    You shouldn't choose your model based on the results you want to get. Otherwise you're not doing data analysis, you're just trying to manipulate people into believing what you want them to believe, not what's actually most likely to be true. – Chill2Macht Jul 25 '17 at 08:35
  • Sorry if you understand that. I'm not english native and my explanations could be imprecise. I'm just trying to have the best forecast. If my forecast is exactly the same as my real data, why doing forecast ? I'm not calling that forecasting. I edited my post to show an example of my data, as you can see, it's non linear. That's why i was focus on the standard deviation to have more variation and not something who is similar to the mean. I commented the answer below too. My main goal is to find what variables are important in my forecasting. – KIToRe Jul 25 '17 at 08:47

1 Answers1

1

The standard deviation of your forecasts has nothing to do with your forecast accuracy, which I assume is what you are interested in.

There are multiple sources of variation in sales. Some of them you can capture, like trends, seasonality or the effects of promotions. Some variations are residual variation, which is essentially random, unless you know the shopping lists of all your customers. Any forecasting algorithm will attempt to separate the explainable variation from the unexplainable variation, and forecast the first kind out. Therefore, the variation in the forecast will always be lower than the variation in actuals.

Or look at things this way: suppose your sales are white noise, normally distributed with some (known) mean and some (known) standard deviation. What's the best forecast? The mean. (Assuming squared loss.) This forecast is a flat line, with no variation whatsoever. Any forecast that is more variable will have a larger squared error.

Or yet a third way to look at this: you can always increase the variability of your forecasts by adding random noise. Will this improve accuracy? Certainly not. (It may look more sophisticated, but it won't be.)

This earlier question may be helpful: Is it unusual for the MEAN to outperform ARIMA? And I always recommend Hyndman & Athanasopoulos' Forecasting: Principles and Practice

Stephan Kolassa
  • 95,027
  • 13
  • 197
  • 357
  • Thank you. I will read your links today. I was speaking of standard deviation because my data are non-linear. I edited to show you a chart of one of the product (Industry stuff like pipes etc... ). So i'm expecting a bit more variation. And for sure i'm not trying to have the same values between real ones and forecasting ones. The main goal is to find the best features who have an impact on my forecasting (Summer/Christmas holidays, Total of customers etc...) – KIToRe Jul 25 '17 at 08:38
  • What do you mean by "non-linear data"? If you are forecasting for inventory control, then you don't want a certain standard deviation of your forecast. What you want is a good forecast of the future density. Often people will aim for an unbiased forecast of expected sales plus a good forecast of the future variance, and then assume that future sales are normally distributed. The variation in your data may be explainable, so adding predictors should reduce the out-of-sample forecast error. Or it may not be explainable, so the best forecast may be a flat line. – Stephan Kolassa Jul 25 '17 at 08:41
  • I mean by "non-linear" that my data have no constant increase. One day, 450 sales, the day after 35, one week after 125, two weeks after 25 and the day right after 325. I don't know if u get it, maybe my explanations are bad. What kind of methods can I use to determine the future variance ? – KIToRe Jul 25 '17 at 09:19
  • Ah. That's not usually called "non-linearity" in the time series literature. It may simply be a case of high variance. I'd strongly recommend that you read an introductory forecasting textbook, e.g. FPP as linked above. After that, you may want to look at models for time-changing variance, e.g., ARCH/GARCH. However, I'd wait with that until you have fit standard models to your data and run standard diagnostics on residuals and out-of-sample errors. – Stephan Kolassa Jul 26 '17 at 08:20
  • Thanks for your answer and your precious help ! I already begin to read FPP. But i really want to use Random Forest so I will see how to suit it to my data. – KIToRe Jul 26 '17 at 08:45