This is clearly just a matter of definition or convention, and of almost no practical importance. If $\alpha$ is set to its traditional value of 0.05, is a $p$ value of 0.0500000000000... considered to be statistically significant or not? Is the rule to define statistical significance usually considered to be $p < \alpha$ or $p \leq \alpha$??
Asked
Active
Viewed 1.4k times
15
Macro
- 40,561
- 8
- 143
- 148
Harvey Motulsky
- 14,903
- 11
- 51
- 98
-
3In many cases (e.g. the usual $z$ or $t$-tests) the distinction literally doesn't matter since the probability that the $p$-value is exactly .05 is 0. This is the case any time the null distribution is continuous. – Macro May 25 '12 at 16:11
-
I'd be curious to have some more context -- why do you care? – Ben Bolker May 25 '12 at 16:12
-
Why do I care? I don't! Why do I ask? One of our customers asked. Our program (GraphPad Prism), it turns out, uses the $p \leq \alpha$ rule, and I wondered how standard that was. – Harvey Motulsky May 25 '12 at 16:26
-
1In a *very* general sense it doesn't matter much, since (given only very modest assumptions) $p$-values are uniformly distributed under the null hypothesis. – cardinal May 25 '12 at 16:53
-
4This problem arises with *discrete* families of distributions, @Cardinal. – whuber May 25 '12 at 17:11
-
@whuber: Right, sans randomization. The latter has theoretical interest, but is distasteful to practitioners for fairly obvious reasons. – cardinal May 25 '12 at 17:23
-
Well why fixate on 0.05. I could say 0.01 should be used. I think it is a mistake to make an issue about the cutoff line for significance. There is always a gray area. More formally we could set thresholds based on a loss function where we tradeoff the risks of type I and type II errors rahter than follow the dogma that the significance level should be 0.05 and that threshold should be used. It forces a particular power function on us. – Michael R. Chernick May 25 '12 at 17:57
-
Even if you want to follow the Neyman-Pearson religion with significance level 0.05 as cardinal points out for continuous distributions the p-value is uniformly distributed on [0,1] under the null hypothesis. So the probability of a p-value being exactly 0.05 is zero. We are splitting hairs over nothing. For discrete distributions the problems get complicated. Fir exact test the power function is saw-toothed rather than monotonic. – Michael R. Chernick May 25 '12 at 17:58
-
1@MichaelChernick, I agree with everything you said, but the OP is asking this question in the context of programming an automatic hypothesis testing function: should that function reject or not when the $p$-value is exactly equal to $\alpha$? – Macro May 25 '12 at 18:11
-
2@Macro In that case it really doesn't matter does it. I would say flip a coin but that introduces a random element. I think the easiest thing would be to always reject at a computed p-value of exactly 0.05 if you must take 0.05 as the cutoff. For a computer algorithm all that matters is consistency and documentation. Whay are we getting all these sophisticated looking answers to a simple and as Harvey says himself a convention that has no prectical importance. – Michael R. Chernick May 25 '12 at 18:29
-
In my opinion, the problem here is trying to automate a concept which has different interpretations in different contexts, and therefore not automatable. This is clear from the discussion about discrete and continuous variables. In terms of Neyman-Pearson philosophy there is no ambiguity because you have a rejection region that gives you the desired error type I-II. – May 25 '12 at 18:45
-
I agree it is trivial. I agree that the probability of P exactly equalling alpha is small (but not zero when you consider the practical issues of computer precision). I agree it is splitting hairs. I agree it doesn't matter. But I disagree that it cannot be automateable. If the whole idea of "significance" is going to be used, the program has to either use a less than, or a less than or equals to, inequality. Which should it be? – Harvey Motulsky May 25 '12 at 22:12
-
@HarveyMotulsky If by automatable you mean that you can create a software for a specific context, I agree. If you mean that it is possible to give a general rule that applies to any context, any discrepancy measure and any hypothesis, I strongly (if there are levels) disagree. – May 25 '12 at 22:33
-
1I think it is a mistake to allow software to use the word 'significant' in its report of the results. That detracts from the responsibility of the investigator to consider the p value in light of other information and theoretical and practical consequences, and to make a reasoned case for why the result is convincing. To report 'significant' for p<=0.05 or for p<0.05 is equally undesirable in that it is applying the Neyman-Pearson approach at a arbitrary level of alpha without the explicit endorsement of the investigator. – Michael Lew May 26 '12 at 01:08
2 Answers
14
Relying on Lehmann and Romano, Testing Statistical Hypotheses, $\leq$. Defining $S_1$ as the region of rejection and $\Omega_H$ as the null hypothesis region, loosely speaking, we have the following statement, p. 57 in my copy:
Thus one selects a number $\alpha$ between 0 and 1, called the level of significance, and imposes the condition that:
... $P_\theta\{X \in S_1\} \leq \alpha \text{ for all } \theta \in \Omega_H$
Since it is possible that $P_\theta\{X \in S_1\} = \alpha$, it follows that you'd reject for p-values $\leq \alpha$.
On a more intuitive level, imagine a test on a discrete parameter space, and a best (most powerful) rejection region with a probability of exactly 0.05 under the null hypothesis. Assume the next largest (in terms of probability) best rejection region had a probability of 0.001 under the null hypothesis. It would be kind of difficult to justify, again intuitively speaking, saying that the first region was not equivalent to an "at the 95% level of confidence..." decision but that you had to use the second region to reach the 95% level of confidence.
-
1Consequentially, you also reject if a test statistic is exactly equal to the critical value. – Guillaume F. Dec 04 '20 at 07:08
11
You've touched on an interesting and somewhat controversial issue. This can be humorously summarized by this image (found on Andrew Gelman's blog but originally courtesy of Dan Goldstein):
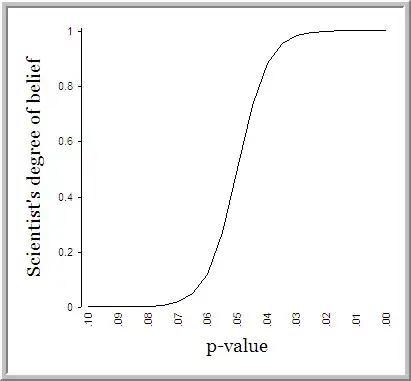
First of all, there is nothing magical about .05. As long as you pick your threshold beforehand, a threshold of .1 or .01 could make just as much sense. To that end, either choosing that you want to use a cutoff of $<.05$ or $\leq.05$ would be equally justifiable, provided that you did not cheat by changing your cutoff after having observed your p-value.
If you want to look at this in the strictest sense then, if you beforehand chose a cutoff of $<.05$ (which I believe to be more "standard") and you observe p to be exactly equal to .05, technically you'd be cheating under standard frequentist techniques. But therein lies part of the problem with this whole approach. We are making a binary problem "statistically significant or not" out of something that is not really a binary problem at all. As Andrew Gelman and Hal Stern aptly put it, "The difference between 'significant' and 'not significant' is not itself statistically significant."
Michael McGowan
- 4,561
- 3
- 31
- 46
-
Thanks for the great graph. I had not seen it before. Funny. And apt. Yes, scientists put way way too much emphahsis on the 0.05 cutoff. I agree that either <.05 a="" am="" any="" asking="" be="" can="" convention="" equally="" for="" from="" i="" is="" justifiable="" logical="" mathematical="" more="" of="" often.="" or="" point="" there="" used="" view.="" what="" whether="" which=""> – Harvey Motulsky May 26 '12 at 00:44
-