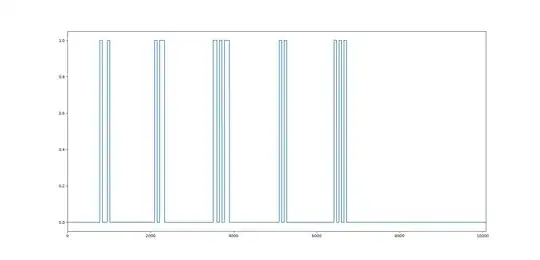
Now the above is my graph. The x axis coordinates corresponded to the minutes. An week contains 10080 minutes. So that is the length of the entire X axis. The graph shows the up time (time during which a particular PC is switched on) of a PC. If y=1 then the PC is on else off. Now if I take the data for multiple weeks then there will be some sort of seasonality. My question is what technique will be suitable for this problem? I have tried ARIMA but I think the lag order should be about 10000. It is not working with such a high lag.
Asked
Active
Viewed 51 times
0
-
Are the values binary (0 or 1)? – Michael M Jul 13 '17 at 07:18
-
Yes. Suppose I find a PC on then I want to forecast if it will be on after an hour. – Alex_ban Jul 13 '17 at 07:37
-
Not a duplicate but there are similarities. That one was accident data and my one is up time. I think mine is a lot more seasonal. Suppose I start to work on my PC from 9 am to 10 am every Monday. I do this for a couple of Mondays. I want to capture such patterns. – Alex_ban Jul 13 '17 at 08:10
-
Arima not good for binary/ordinal responses for sure – Tommaso Guerrini Jul 13 '17 at 09:24
-
Then what is good? @TommasoGuerrini – Alex_ban Jul 13 '17 at 09:47
