3

I am trying to enhance the contrast in the images I get after scanning a surface using Thermography (Principal Component Thermography ~Rajic, which is basically an application of Principal Component Analysis) to see the defects clearly.

But my question here is to understand the difference between empirical orthogonal functions and Principal Components as shown below: figure SVD is used to decompose matrix A into U, R, and V.
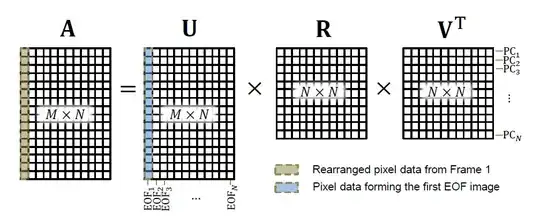
In my case, I have 20 images. And after doing a raster like operation to unroll an image in a column, I get my matrix A which has 20 columns and each of them represents one image.

Any intuitive explanation will be really appreciated.

amoeba
  • 93,463
  • 28
  • 275
  • 317
  • Does this help? https://stats.stackexchange.com/questions/88118 – amoeba Jul 05 '17 at 13:21
  • Also, you have 20 images, but what is the dimensionality of each image? Do you center rows or columns before doing SVD? – amoeba Jul 05 '17 at 13:23
  • Each image is 180*180. I put each image in column, so my matrix A comes out to be 32400*20 and then I center rows before doing SVD. Am I right? – Rumi-Thermo Jul 06 '17 at 04:40
  • Yes. So "EOFs" are of length 32400, meaning these are PCA eigenvectors aka "principal directions" aka "principal axes" aka (in image processing) "eigenfaces". What is called "PCs" on this figure are PC scores (normalized to unit length). See the thread linked above. Does it make it clear? – amoeba Jul 06 '17 at 07:19
  • @amoeba. I got a bit confused here. After going through your explanation on this _link_ [link] https://stats.stackexchange.com/questions/134282/relationship-between-svd-and-pca-how-to-use-svd-to-perform-pca) I got that "V" here are "principal axes/directions" and X*V=U*S are the Principal components ("scores"). But now here you are saying U to be "principal directions/principal axes". – Rumi-Thermo Jul 06 '17 at 08:19
  • @amoeba Also isn't covariance matrix equation X*(X^T) according to this link [link](https://math.stackexchange.com/questions/3869/what-is-the-intuitive-relationship-between-svd-and-pca) but you mentioned it to be (X^T)*X on this link [link](https://stats.stackexchange.com/questions/134282/relationship-between-svd-and-pca-how-to-use-svd-to-perform-pca) – Rumi-Thermo Jul 06 '17 at 08:21
  • See point #6 in the linked answer... Re covariance matrix, it's the same issue: whether samples are in rows or in columns of the data matrix. It's standard in statistics to have samples in rows, but on your figure in this Q you have them (images = samples) in columns. – amoeba Jul 06 '17 at 08:23
  • @amoeba I think now I got it, so if I put my images in rows instead of columns then "V" will be my principal direction/axes and "U" will be principal component as explained in the linked answer – Rumi-Thermo Jul 06 '17 at 08:28
  • @amoeba when I read your complete post on this [link](https://stats.stackexchange.com/questions/134282/relationship-between-svd-and-pca-how-to-use-svd-to-perform-pca) so I got to this conclusion that if V is your principal axes/direction then Y=X*V (where X is the data matrix) will give you the principal components which is also equal to U (Y=X*V=U*S). So, the case mentioned above in the question then $Y=U^T*X=S*V^T$ but when I checked it using Matlab, they are not equaly, But $X*V=U*S$ are equal. Why is it like that, because I thought that the principal axes and components are changed now? – Rumi-Thermo Jul 07 '17 at 08:05
  • If X=USV' is the SVD, then XV=US and U'X=SV'. Both equations should hold in all situations, irrespective of the contents of matrix X. Are you saying that you can verify the first but cannot verify the second? – amoeba Jul 07 '17 at 08:09
  • @amoeba Sorry, I was checking my code and found a mistake in it. You are right irrespective of the contents of matrix X both equations hold. But the only confusion left with me now is that when is U a principal component and when is V a principal component, and does it has to do with size of matrix e.g. if I have size (n*m) matrix, then we have nm? something similar is explained on this link [link](http://www2.imm.dtu.dk/pubdb/views/edoc_download.php/4000/pdf/imm4000.pdf) but I think the author has done some mistakes in equations, it's hard to follow him. – Rumi-Thermo Jul 07 '17 at 11:33
  • The size of X does not matter, what matters is only the orientation: whether samples are in rows or in columns (as explained here https://stats.stackexchange.com/a/134283, in particular #6 as referenced earlier). – amoeba Jul 07 '17 at 11:34

0 Answers0