6

I have data sets of network traffic that exhibit strong diurnal effects making them non-stationary. One of the analysis that I want to run is to show correlation between days. If we chopped up the time series into individual days, how would I

  1. ...show the individual time series are stationary? Would applying Augmented Dickey-Fuller be enough?
  2. ...perform cross-correlation? Would computing Pearson's be enough?

The next step is to check for long range dependence. This a tougher challenge since I can not chop up the time series into individual days. Any ideas?

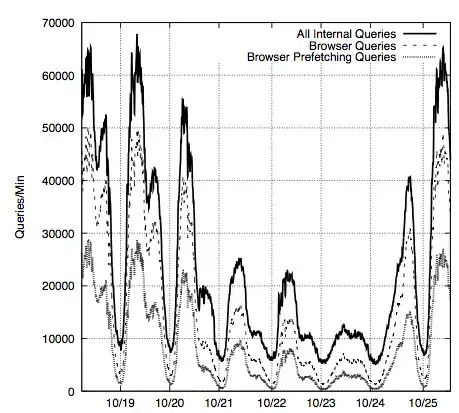
The final question is in reference to the figure I am attaching, the 3 time series on that figure are non-stationary. I want to check for correlation, should I use chop them into smaller hourly/daily time series or apply a decomposition method. I am not too familiar with detrending or differencing methods. Any pointers would be great.

Figure

kjetil b halvorsen
  • 63,378
  • 26
  • 142
  • 467
creatiwit
  • 123
  • 1
  • 5
  • 1
    I think you forgot the figure. I also think it would help to clarify what you mean by diurnal or what your time unit is. It sounds like you have daily data, but to me diurnal means recurring every day, which means you have higher frequency data (like hourly). – dimitriy May 16 '12 at 20:34
  • 1
    Explain what you are doing so that we can evaluate your approach. Nonstationary time series do not have to be analyzed by chopping them up into stationary pieces. It is more common and probably better to fit (or remove the nonstationary component first (e.g. low order differencing for polynomial trends and seasonal differencing for periodic components. The residual series is then analyzed as a stationary time series. – Michael R. Chernick May 16 '12 at 21:43
  • @DimitriyV.Masterov the data is of event counts observed at a server, there is a very obvious pattern of peaks and valleys that correspond with server load as folks come to work and leave work. What I am trying to do is really twofold, 1) summarize the data and 2) build a predictive model. One of the problems is the data is pretty noisy and there are sudden increases in traffic, but we want to capture those trends as anomalies. I am afraid differencing might remove those anomalies. – creatiwit May 16 '12 at 22:13
  • 1
    I've had really good luck with a similar type of problem using the approach suggested by IrishStat in http://stats.stackexchange.com/a/27338/7071. With a high frequency data like that, the standard time series approach can be difficult. – dimitriy May 16 '12 at 22:29
  • @DimitriyV.Masterov if I understand the approach correctly it is similar to my slicing idea but at much smaller granularity 15 mins in the example you provided. Was 15 mins picked because it was largest quanta in which stationarity was guaranteed. As I mentioned before I am afraid slicing might not allow for predictions, which is fine. But how would you go about making that exact point, i.e time series analysis for high frequency data might not allow for prediction modeling. – creatiwit May 16 '12 at 22:42
  • This may or may not be a seasonal problem. If you post several weeks worth of data on one of the data series (if you're using R, use `dput()`), I think you'll get a better response. – bill_080 May 17 '12 at 01:25
  • @shrin That's the scale I used as well since that seemed to "smooth" the series considerably. I think smaller time buckets would work as well. – dimitriy May 17 '12 at 13:10

0 Answers0