5

I am using keras to train a 5 layer regression model to predict 1000 different thermometers. I train a model and then ask it to predict what the reading will be based on 20 other instruments. I wanted to see if I am doing things correctly, so I trained 10 different models on the same data and with the same parameters and got 10 different model files. I then asked each of the 10 model files to predict a bunch of temperatures. For some of the thermometers, the temperature predictions were pretty consistent across the models, while for others the temperature predictions were all over the place. Here is an example of what I mean:

        | predicted_temp_for_sensor_1 | predicted_temp_for_sensor_2 |
        |-----------------------------|-----------------------------| 
model_0 |                        99.1 |                        78.1 |
model_1 |                        97.2 |                        85.5 |
model_2 |                        96.1 |                       110.7 |
model_3 |                        95.3 |                        80.8 |
model_4 |                        96.4 |                        90.8 |
model_5 |                        97.8 |                        95.7 |
model_6 |                        98.6 |                        92.5 |
model_7 |                        97.9 |                        87.1 |
model_8 |                        99.4 |                        98.8 |
model_9 |                        96.1 |                        85.6 |

To make it more obvious, here as some summary stats for the two sensors:

             | predicted_temp_for_sensor_1 | predicted_temp_for_sensor_2 |
             |-----------------------------|-----------------------------| 
 predictions |                          10 |                          10 |  
        mean |                        97.4 |                        90.6 | 
standard dev |                         1.3 |                         9.0 | 
         min |                        95.3 |                        78.1 |
         max |                        99.4 |                       110.7 |

What can this mean? Is this a sign of model uncertainty? Should I interpret this as low confidence in the predictions? I have no idea what to think about this.
user1367204
  • 831
  • 3
  • 10
  • 18

2 Answers2

6

This is normal and exactly what you should expect. Often, deep models are exquisitely sensitive to the initial parameters. It would appear that they are exquisitely sensitive to the first step taken, even. This is because the loss function is non-convex and optimization procedures have difficulty finding any kind of global minimum--the existence and locatability-by-an-optimization-algorithm of which would make your models the same every time. This is therefore not necessarily an indication of uncertainty in your model.

What to do? (1) You might as well try 10 different random initializations or train it 10 different times with the same initialization and take the one that gives you best results. (Generally when DL is applied, it seems that practitioners are measuring Performace on massive held out sets--CV isn't even feasible.) (2) Read Chapter 8 of Deep Learning by Goodfellow et al. before returning to the answers to this post. It is very interesting and might give insight into what you're seeing.

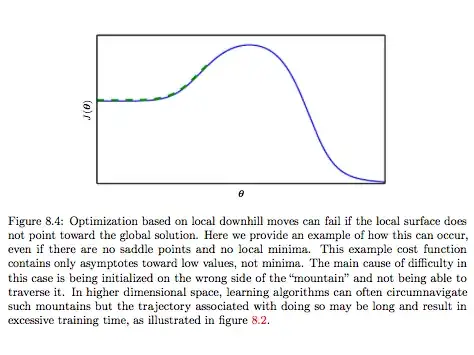
Here is a revealing diagram shown there.

enter image description here

Devising an optimization procedure that will arrive at the same solution in high dimensions regardless of where it begins is an area of active research, compounded by the difficulties shown just above; besides trying to navigate a nonconvex topology, things like the amount of training iterations might now dictate where you land depending on where you start.

Even if you weren't initializing differently each time, you still could find very different models. You may not even be ending up at different local minimima; in high dimensions, you could land at a saddle point, or plateau, etc, etc. Sometimes, à modeler stop training because the training error plateaus but the norm of the gradient continues to increase, suggesting that it hasn't even reached a critical point!

Ultimately, training deep models can take months for these reasons and appears to be part art. If you're looking for a model that trains the same way every time, consider one of the myriad models with convex losses (e.g., SVM, LR).

Perhaps you don't have enough data to train a very deep model...perhaps with enough data the training would be more stable..but I don't think this is necessarily the case.

sjw
  • 5,091
  • 1
  • 21
  • 45
4

Assuming that your classifier is trained well and not over- or underfit, this can usually be taken as a measure of uncertainty: for some reason, different models using the same training data get different results.

This could be possibly because you simply cannot predict this temperature well from the data, e.g. there is no clear correlation available.

Another reason could be train/test data differences. It is a common problem that the training data differ from the test data (e.g. when training on simulation but predicting real events). Highly varying predictions can indicate that (at least the varying feature) is badly represented in the training sample.

What I would propose you to do:

  • Split your training sample, say 80'000 to 20'000, then train your ten models on the former sample and test them on the latter sample. If the variation reduces, it is because of the second reason stated above.
  • Go over your data from an experts point of view: are there variables which probably are more/less correlated?
  • Don't forget about the order of magnitude! If your left temperature has a std of 1 and the one on the right of 10, this could also be because the temperatures in the data of the left vary in a much narrower field. As an example, compare the prediction of the earth surface temperature vs the temperature at the surface of the sun. Of course the prediction about the sun is, absolutely compared, much more off then your prediction about the earth temperature. If this could be a problem, you may scale the errors by dividing them by the mean (or similar).
Mayou36
  • 1,008
  • 8
  • 19
  • Thanks for your input, is there anywhere you can link to where I can read more about your "this can usually be taken as a measure of uncertainty" statement? – user1367204 Jun 14 '17 at 17:05
  • I actually don't have a single link. AFAIK this technique is often used in context with financial data analysis. But there is a much simpler answer on that: it is basically MC error propagation. You vary what you can vary (your network) and see how the output changes. This yields the possible deviation. But in the end, error propagation is usually a little bit more then that as it requires some domain-knowledge as well. Still, for some statistical part, the above MC error propagation is quite a good thing! – Mayou36 Jun 14 '17 at 20:56
  • Does MC mean Monte Carlo in your comment? Also, are you saying that this variance is a good thing because low-variance and high-variance results are MORE information and MORE information is good? – user1367204 Jun 15 '17 at 15:58
  • @user1367204, yes, MC means Monte Carlo, my bad! And yes, it is more information, namely it gives an estimation of how far off your value is *at least*. This is "good" in a sense, yes. – Mayou36 Jun 15 '17 at 18:37
  • Do you have any recommendation for a way to incorporate this information into a prediction report? – user1367204 Aug 02 '17 at 17:32
  • @user1367204, yes. Basically, the statement you could make is: under the assumption that the predicted data originates from a process following the same rules as the training data (or shorter: that a generalization from the training data and test data is possible), a systematic uncertainty of *your-standard-deviation-or-similar-here* is induced due to the specific choice of a certain model (and you may specify, appendix?, how this is done as it is, presumably, not a very well known thing to do). You may reformulate this accordingly, of course. What do you think of this? – Mayou36 Aug 03 '17 at 11:33
  • So basically tell people how much each temperature varies across the models? So for my specific example (described in the original question) I would do `predicted_temp_for_sensor_1 --> mean 97.4 (sd 1.3)` and `predicted_temp_for_sensor_2 --> mean 90.6 (sd 9.0)`. Is that what you are suggesting? – user1367204 Aug 03 '17 at 14:16
  • @user1367204, yes, basically. But I would make clear that: this is a systematic effect of the model and that the predictions may vary about this value depending on which *model* you choose and that this is the error accounting for the model difference but not for *how good the model actually is*. This is another error that should be taken into account. So if your models predict within 10% of the true temperature, this is an additional uncertainty which is (more or less) independent from the first one. Depending on your application, one or the other matters more/less – Mayou36 Aug 03 '17 at 15:21