2

Hi all sorry if I am not very well prepared for this question. I just have a vague idea about what I am trying to achieve without knowing much statistics, but its of urgent nature that is why I am asking here.

So I have around 78 data points that I want to plot in a line graph. Each data point is an average over 20 values. If I am plotting two of such lines next to each other I want to show some kind of error bars that would show the significance of mean/average values. To be exact I want to show that if error bars overlap between the two lines then there is no significant difference between the data points however if they do not overlap then those points are significantly different. For some reason I have this impression that it could be done using Least significance difference (LSD). Any other method would also work.
  • 1
    Can you provide more detail about the comparisons?. Least significant difference refers to multiple testing. – Michael R. Chernick Jun 14 '17 at 14:33
  • Welcome to Cross Validated! Please consult a basic reference, e.g. https://onlinecourses.science.psu.edu/stat502/node/216, & come back here with anything that's still unclear. We can't be expected to try to work out what you did before from a formula in a spreadsheet we can't see, though it looks odd - you don't seem to be allowing for different level means when calculating the mean square error, & 2.093 is the critical value for the t-statistic with only 19 degrees of freedom. – Scortchi - Reinstate Monica Jun 14 '17 at 14:51
  • Hi both thanks for comments. I know its not very well worded but I just have a vague idea about of what I am trying to achieve without knowing much statistics. So I have around 78 data points that I want to plot in a line graph. Each data point is an average over 20 values. If I am plotting two of such lines next to each other I want to show some kind of error bars that would show the significance of mean/average values. To be exact I want to show that if error bars overlap between the two lines then there is no significance however if they do not overlap then those points are significant. – Rohit Farmer Jun 14 '17 at 15:02
  • I think that comment is much clearer - could you edit it into the question? (I'd advise cutting the first paragraph all together unless you provide enough detail to make it clear what's being calculated.) – Scortchi - Reinstate Monica Jun 14 '17 at 15:16
  • Thanks! I was searching while you were editing & think the answer [here](https://stats.stackexchange.com/q/18215/17230) should help. – Scortchi - Reinstate Monica Jun 14 '17 at 15:28
  • Thanks @Scrotchi for directing me to the other article. Its very informative. For current task I think I should just go with Confidence Intervals at 95% confidence level. Libre office has an existing command CONFIDENCE(α; sd; size) to do this. – Rohit Farmer Jun 14 '17 at 15:49
  • Well, in that case bear in mind that using non-overlap as a test equates to stipulating a significance level of around 0.5% - rather stringent. – Scortchi - Reinstate Monica Jun 14 '17 at 16:18

1 Answers1

1

With the help of the comments on my above posted question I can narrow down to using confidence intervals for what I think should suffice the difference in the mean that I am trying to project. However, this statement is not from a very informed statistician.

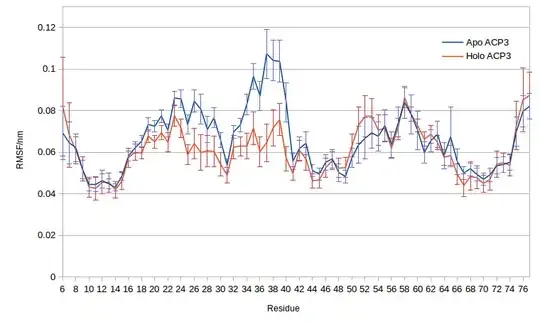
enter image description here

The graph above shows two forms of protein structures that are being simulated. X axis shows the amino acid positions in the protein and Y axis shows average root mean square fluctuation over 20 replicates. Error bars shows Confidence Intervals (CI) with a 95% confidence level, which I think means that the mean of the entire population lies within ±CI of the sample mean.

So the amino acid positions for which error bars are not overlapping have significant different fluctuations.

I calculated the CIs using =CONFIDENCE(0.05,SD,20) command in LibreOffice.

I hope it sounds reasonable?

  • Results can be significant even if the confidence intervals overlap. The minimum mean difference required for a significant difference is about 3 standard errors whereas confidence intervals will overlap unless means are more than 4 standard errors apart. – David Lane Jun 14 '17 at 18:36
  • Thanks @DavidLane for your advice. I will keep this in mind while writing my inference. – Rohit Farmer Jun 15 '17 at 05:33
  • 1
    There is some difficulty due to the correlation between the points. **On the one hand:** Imagine the situation when the blue line would be consistently larger than the red line, but the confidence/error bars always overlap. You could say that there is no difference but that sounds not right. You should be able to combine averages of multiple points, which increases the accuracy and finally results in finding out a significant (although tiny) difference. **On the other hand:** Correlation will interfere with post-hoc test assumptions such as in Holm Bonferroni, yet, this still means H_0=false – Sextus Empiricus Mar 29 '18 at 08:14
  • 1
    While the graph already shows clearly differences (I don't think you need to perform a test), if you want to do it more formally (for whatever reason) then I guess you need some model of the curve that incorporates a shift of the mean average and correlation between the points, then compare the parameters of the model. – Sextus Empiricus Mar 29 '18 at 08:19