1

When researching the reciprocity failure (a feature of film photography, otherwise more appropriate to https://photo.stackexchange.com/) I have run into a statistical issue.

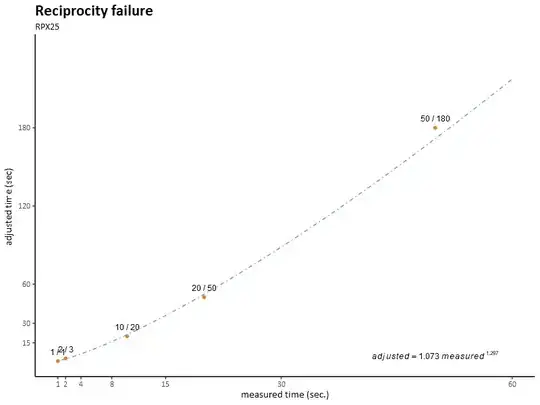
I have a datasheet for a photography film specifying the measured and effective exposure time for 5 exposure times. I found these times highly inconvenient (by convention the exposure times in photography go in powers of two - 1 second, 2, 4, 8, and then 15, 30 and 60 seconds to make a round number). As a result I set out to extrapolating my own values.

When I tried a number of possible regressions in RStudio I found the best fit with a power function.

enter image description here

My problem is that I am aware that 5 data points make a very small data set (but that is all that I have). I am not comfortable throwing various functions at it until something sticks.

Is there a general rule / a piece of advice when a power function is appropriate, and when a different function - such as exponential (which in my case seemed a poor fit) - would be a better choice?
kjetil b halvorsen
  • 63,378
  • 26
  • 142
  • 467
Jindra Lacko
  • 111
  • 6
  • 1
    This is an *exponential*, not a "power function." Perform the analysis in terms of the *logarithms* of the times: this is a more scientifically relevant way to express them. But just about any curve that closely fits all five points will perform well for *interpolating* among them. For *extrapolation*, you need a physical or chemical theory to suggest what happens with the longer exposure times. For instance, a [Swarzschild-like law](https://en.wikipedia.org/wiki/Reciprocity_(photography)#Simple_model_for_t_.3E_1_second) fits the posted data a little bit better than the curve shown. – whuber Jun 01 '17 at 20:37
  • @whuber I went the logarithm way `lm(formula = log(adjusted) ~ log(measured), data = rpx25)`, where rpx25 are my data points. What I understand - and I am more comfortable discussing artistic impact of long exposure photography than logarithms - is that this transformation leads to a equation in form adjusted = a × measured ^ b function, not adjusted = a ^ measured (which is what I would call exponential). – Jindra Lacko Jun 01 '17 at 20:59
  • Okay, that works. I found it interesting that the mere addition of one second to the times noticeably improved the fit. Indeed, if your sole purpose is to interpolate among these points, it would be attractive to vary that value of one second in the Schwarzschild law (between perhaps 0 and 10 seconds) and select the value that gives the best fit. Although that would normally be considered a gross over-fit--three parameters for five points!--it does have a justification in theory and practice. BTW, if you can, you should measure the times of less than 10 sec. more precisely. – whuber Jun 01 '17 at 21:52
  • I added the one second again by convention - no Schwarzschild effect for exposure times at or below 1 sec (i.e. for times <= 1 sec. measured = adjusted). The boundary is arbitrary, but it works in practice. But you nailed my issue - at this few data points it seems a *too good to be true* fit. That is what I am uncomfortable with. On the other hand I am OK with only interpolating - for my application I do not require times above 60 seconds. – Jindra Lacko Jun 01 '17 at 22:30
  • Physico-chemical data like these, which are expected to follow simple laws, can often be fit exceptionally well. (See the example at the beginning of my post at https://stats.stackexchange.com/a/35717/919, for instance.) Interest in such cases often focuses on the relatively tiny deviations from the fit, because a good fit is a foregone conclusion. Contrast this with other data where no law is known or has any basis to exist: if you use many parameters (such as a high-order polynomial), the fit can *look* good but be wildly off when you interpolate. – whuber Jun 01 '17 at 22:45
  • 1
    thank you @whuber for your kind comments - these are very enlightening. I feel more comfortable interpolating from the function as it is. – Jindra Lacko Jun 02 '17 at 14:19

0 Answers0