3

On homework assignment I was asked to match different r values (namely $1$, $0.7$, $0.4$, $0$, $-0.4$, $-0.7$, $-1$ and "r value not defined") with some graphs. Among the graphs there were funny looking ones (can be found below) and the "weird" shape, I think, hints at the "not defined" option.

Are the r values really not defined here? Before this exercise, I was under the impression that every graph in the world can have a linear regression r coefficient—It's just that if the graph is scattered or funny looking, the r value will be about $0$. Is that really the case?

enter image description here

Friedman
  • 133
  • 6
  • What are the axis of these graphs? – cdutra May 26 '17 at 00:01
  • 1
    Yes in the sense that you can always compute the total sum of squares and residual sum of square and hence the ratio of 1-residual sum of squares divided by total sum of squares. – Michael R. Chernick May 26 '17 at 01:02
  • 1
    Building on @MichaelChernick, you can always calculate an $r^2$ based upon some finite sample and calculate some sample correlation coefficient (i.e. for your sample), but there are pathological distributions (eg. Cauchy) where 1st or 2nd moments don't exist, hence the population, correlation coefficient $r$ doesn't exist! You could always run a linear regression on a sample from such a distribution, but you won't get well behaved results. – Matthew Gunn May 26 '17 at 05:21
  • The question has changed considerably. It is not clear what the graphs represent relative to your data. – Michael R. Chernick May 26 '17 at 15:18
  • The x-axis is the independent variable. The y-axis is the dependent variable. No further details were given. What's most striking about these graphs is that they don't represent well defined functions (in our usual sense of single valued relations). That confused me. After @Glen_b 's answer I think I have firmer grasp on the subject. – Friedman May 26 '17 at 23:43
  • Sorry - "...they don't *seem to* represent well defined functions..." – Friedman May 26 '17 at 23:51

2 Answers2

7

It's possible to have undefined correlation -- what if one of the variables has zero standard deviation?

Consider for example

x   1   1   1   1 
y   0   2   3   5   

That said all those plots in your question have defined correlation... each of them is 0. Indeed, here's a new version of that plot which I generated randomly, with sample correlations (to the printed accuracy):

Plot of 5 different patterns - symmetric quartic, quadratic, back-to-back quadratics, points scattered around a ring, four "splotches" like dots representing 4 on a die


from comments:

Where in the calculations do we get zero in the numerator..? –

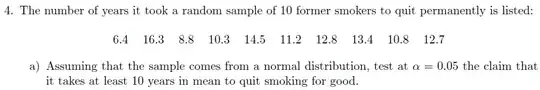
The numerator has a sum of products $\sum_i (x_i-\bar{x})(y_i-\bar{y})$. Each of those product-terms is a "deviation from horizontal mean, $\bar x$" times "deviation from vertical mean, $\bar y$. That contribution will be positive if both deviations have the same sign (both positive or both negative) and negative if they have opposite signs. Consider the signed area of a rectangle in these images representing contributions of such a product to the sum in the numerator:

contributions as product from points with positive x -- positive y deviations and negative x -- positive y deviations of the same size but opposite sign
(red for positive, blue for negative)

... representing the contributions of two points.

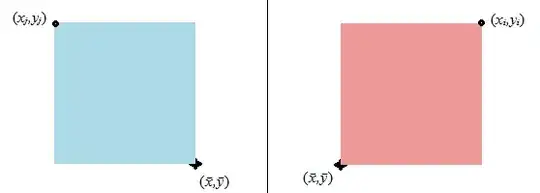
When the picture has left-to-right reflection-symmetry then for each region in the plot contributing points like the one shaded red there's a corresponding region the opposite side of $\bar{x}$ contributing points like the one shaded blue (with perfect symmetry there will always be a pair of points that exactly cancel).

Similarly with top-to-bottom symmetry:

contributions as product from points with positive x -- positive y deviations and positive x -- negative y deviations of the same size but opposite sign

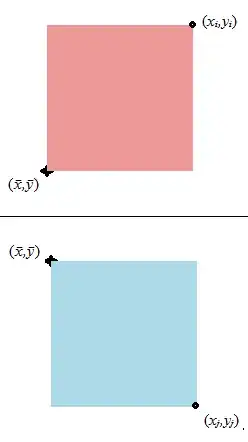
but this time there's a region as far the other side of $\bar{y}$.

As a result, any plot that shows reflective symmetry left to right or top to bottom will have a correlation-numerator of about 0 (or with perfect symmetry, of exactly 0). Every one of those five plots has left-to-right reflective symmetry and the last three have top-to-bottom symmetry as well. Consequently as long as neither variable has variance zero, the correlation will be zero. We can assess these symmetries with a mere glance and immediately and confidently conclude that they indicate no correlation.

Glen_b
  • 257,508
  • 32
  • 553
  • 939
  • Thanks. I hope that gave me firmer grasp of the matter, I'll do a bit more research to make sure I understood. – Friedman May 26 '17 at 23:58
  • You know what, I'll ask another thing: I understand why *literally* these graphs represent uncorrelated variables. What I don't understand is how it comes about arithmetically. Where in the calculations do we get zero in the numerator..? – Friedman May 27 '17 at 00:13
  • I have answered above, at some length. If you need additional clarification, ask. – Glen_b May 27 '17 at 01:52
3

For some distributions, the correlation coefficient does not exist. For example, the Cauchy distribution. For the estimate of the correlation coefficient, you give me $n>2$ pairs of $(x,y)$. I can estimate it for you given that all of $x$'s are not exact the same AND all of $y$'s are not exact the same.

Suppose in your 5 graphs the x axis are horizontal lines and y axis are vertical lines, I would say their r's are zero.

Lucas Farias
  • 1,232
  • 1
  • 8
  • 22
user158565
  • 7,032
  • 2
  • 9
  • 19