I am trying to analyse this data, in order to try to estimate the percentage of tickets that can be sold for an event (events, based on venue will have different capacity). I have two covariates which are artistRating and artistVotes, and two factor variables paintingTitle and artistName with 1059 and 286 levels respectively, along with a timestamp.
> str(bob_new)
'data.frame':   4078 obs. of  8 variables:
 $ ticketCount  : int  9 10 15 21 17 24 19 19 15 16 ...
 $ ticketsRemain: int  21 10 21 13 0 1 6 21 15 4 ...
 $ artistRating : num  4.38 4.23 4.57 4.35 4.32 4.48 4.32 4.42 4.55 4.32 ...
 $ artistVotes  : int  616 401 481 100 113 657 157 350 406 33 ...
 $ artistName   : Factor w/ 286 levels "Abbi Macfarlane",..: 254 191 277 65 212 200 75 9 188 211 ...
 $ paintingTitle: Factor w/ 1059 levels "\"Baby, it's cold outside\" - Brown Wash Rustic Wooden Sign",..: 1013 745 958 473 725 40 521 472 992 1013 ...
 $ date         : Date, format: "2016-12-01" "2016-12-01" "2016-12-01" "2016-12-01" ...
 $ percent      : num  0.3 0.5 0.417 0.618 1 ...

> head(bob_new)
  ticketCount ticketsRemain artistRating artistVotes                      artistName             paintingTitle       date   percent
1           9            21         4.38         616 Stella Mandrak-Pagani #TeamAjaz        Winter OWL in snow 2016-12-01 0.3000000
2          10            10         4.23         401                       Meg Burns      Simi Cherry Blossoms 2016-12-01 0.5000000
3          15            21         4.57         481                  Veronica Stach Where the Wild Things Are 2016-12-01 0.4166667
4          21            13         4.35         100            Christine "Chri" Lee          Lust in the Wind 2016-12-01 0.6176471
5          17             0         4.32         113         Nicole Pinder #TeamAjaz             Seagull Beach 2016-12-01 1.0000000
6          24             1         4.48         657                Monique Ra Brent       Aurora on the River 2016-12-01 0.9600000
What would be an intelligent way to approach this task? I found a package :prophet https://facebookincubator.github.io/prophet/ Which allows for an analysis of the time series, it seems to me however that it has one major weakness, that it does not allow for the inclusion of other variables, however with the advantage that it can "understand" seasonality, which in this case does seem relevant.
I have done a few manipulations see: Poisson regression with strong pattern in residuals
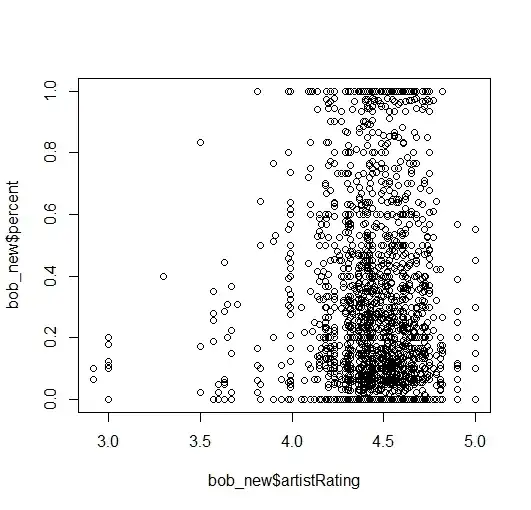
However I do not manage to obtain convincing models as the data is very clustered:
What would be recommendations that you would have as to what type of models I could use in order to be able to make predictions? I am still a novice in data analysis (still undergrad), so I have had exposure to a variety of glm but never thorough applications.
I would appreciate any reference and advice!
EDIT: this seems like it would be relevant : Building a linear model for a ratio vs. percentage?

