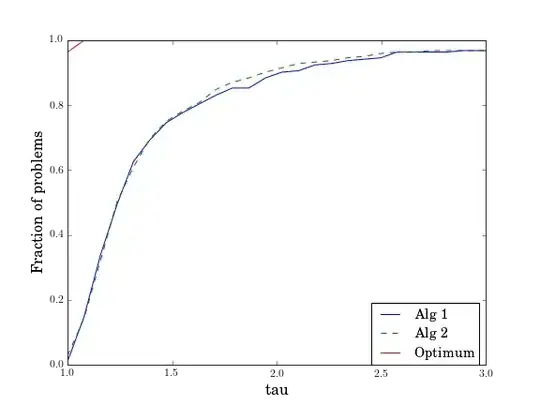
I am solving a large set of nonlinear optimisation problems using different algorithms. I have compared their performance using performance profiles (see Dolan and Moré, 2002). These profiles are figures that indicate the global performance of an algorithm. They indicate what fraction of problems are solved within a factor $\tau$ of the best problems. An example can be seen below.

The difference between these two algorithms is clearly not very large. They both solve 80% of all problems within 1.5 times the optimum.
My question is: can I quantify the difference between these two algorithms using statistics?
I have looking into the student t-test and the Wilcoxon test, but if I understand correctly these assume some kind of stochastic nature of the sampling method. The algorithms I use are deterministic; when solving the same problem, they always produce the same result.
Using things like the average is possible, but that would not yield more information than the above performance profile.
UPDATE
One of the founders of the performance profiles writes me that he wouldn't know "how to quantify the difference between the solvers in any significant way" when the profiles cross or when one profile is not on top of another. It would thus be quite spectacular if someone could come up with an idea.