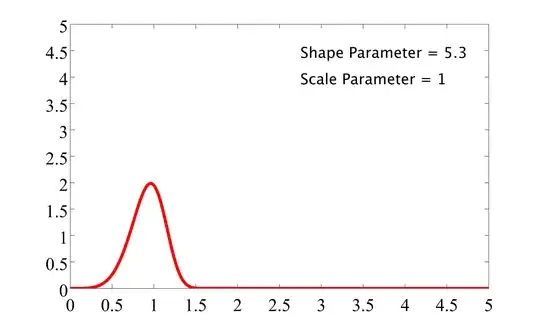
I'm using MATLAB to plot the Weibull distribution function. But the y-axis, obviously, is not probability. Also, the plot on Wikipedia (here)has same y-axis as mine, so my question is: is there something wrong here? I'm pretty sure that my code is correct. So Why the y-axis is not probability ?
Asked
Active
Viewed 15 times
0
FantasticAI
- 417
- 1
- 4
- 12
-
Because this is probability density function... – Tim Apr 29 '17 at 06:20
-
density is not probability – Glen_b Apr 29 '17 at 08:51