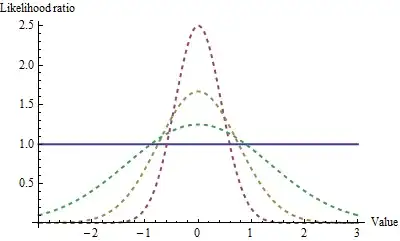
A likelihood is a measure of how well a particular model (probability distribution and set of parameters) fits a given set of data.
If we want to compare how 2 different models fit the same data then we can compare the likelihoods. The most common way to compare the 2 likelihoods is to look at their ratio (because of the mathematical and theoretical properties), this is the likelihood ratio.
That is the short answer. The reason you saw so many confusing things in the search is that there are a lot of details that depend on which models you want to compare, what assumptions you are making, how well some things approximate other things, how big of a ratio is meaningful, etc.
Edit
Here is a simple example:
Say I have a friend that claims he can read my mind, it is not perfect but he thinks he can do better than guessing. We decide to do an experiment where I flip a coin and then concentrate on whether the coin shows heads or tails (while hiding the coin from my friend), he then tries to read my mind or guess and we do this a total of 10 times. My skeptical model is that he will be right about half the time (pure guess or always choosing heads would give this result). My friend's model is that he will be right about 70% of the time. We both agree that the binomial distribution is appropriate. So if the number of correct guesses is $x$ then the likelihood for my model is ${10\choose x} \cdot (0.5)^x \cdot (1-0.5)^{10-x}$ and for my friends model is ${10\choose x} \cdot(0.7)^x \cdot (1-0.7)^{10-x}$. So simplifying a little the likelihood ratio would be $ \frac{0.7^x \cdot 0.3^{10-x}}{0.5^{10}}$.
The more common significance testing approach would keep my $0.5$ value as the null hypothesis, but then replace the $0.7$ with the actual proportion observed (this guarantees that the ratio will be at least 1) then use an approximation on the distribution under the null to compute a p-value. Algebra can convert this into the usual normal approximation test for proportions.
