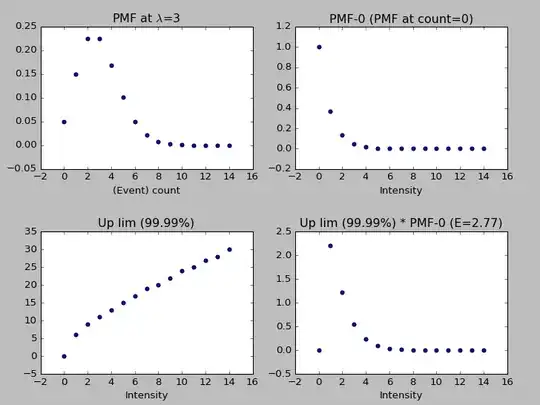
I am writing software, that keeps track of hourly rates of certain incidents in historic data. I find that the generating process of these incidents is acceptably well described by a poisson process.
As such, I estimate the intensity $\lambda$ from the historic data to be the hourly mean and subsequently raise an alert as soon as an observed event count (in real-time) exceeds some upper limit. I choose that upper limit such that it is still consistent with the historic event counts within probability $p=99.99$%, here I mean the event count where the distribution function reaches 0.9999.
Sometimes however, the historic data is limited in time and the observed event count is 0. I may need a different mechanism here.
As an example: If $\lambda=3$, then the probability of observing no events is $5$%. And with $\lambda=3$, an event count of 11 events in the same amount of time would still be consistent within $99.99$%. Hence, I'd put my upper limit at 12, but that is only for $\lambda=3$ ...
Given the observation of 0 events, the value of $\lambda$ has a distribution of its own. But how then do I derive an upper limit generally, can I simply take the expectation value like so:
$E_{\textrm{ul}}=\frac{\int\,\textrm{pmf}_{0}(\lambda)\cdot\,\textrm{ul}(\lambda)\,\textrm{d}\lambda}{\int\,\textrm{pmf}_{0}(\lambda)\,\textrm{d}\lambda}$
where pmf$_{0}(\lambda)$ is the probability mass function at $\lambda$ evaluated at an event count of 0 and ul$(\lambda)$ is the value of the distribution function at $p=0.9999$ (which leads to an expectation of 2.8)?
Or should I take the expectation of $\lambda$:
$E_{\lambda}=\frac{\int\,\lambda\,\textrm{pmf}_{0}(\lambda)\textrm{d}\lambda}{\int\,\textrm{pmf}_{0}(\lambda)\,\textrm{d}\lambda}$
and use that to derive the limit (leading to 5)?
I tried both approaches and they lead to different numbers ... why is that?
