In my project I want to create a logistic regression model for predicting binary classification (1 or 0).
I have 15 variables, 2 of which are categorical, while the rest are a mixture of continuous and discrete variables.
In order to fit a logistic regression model I have been advised to check for linear separability using either SVM, perceptron or linear programming. This ties in with suggestions made here regarding testing for linear separability.
As a newbie to machine learning I understand the basic concepts about the algorithms mentioned above but conceptually I struggle to visualise how we can separate data that has so many dimensions i.e 15 in my case.
All the examples in the online material typically show a 2D plot of two numerical variables (height,weight) which show a clear gap between categories and makes it easier to understand but in the real world data is usually of a much higher dimension. I keep being drawn back to the Iris dataset and trying to fit a hyperplane through the three species and how it's particularly difficult if not impossible to do so between two of the species, the two classes escape me right now.
How does one achieve this when we have even higher orders of dimensions, is it assumed that when we exceed a certain number of features that we use kernels to map to a higher dimensional space in order to achieve this separability?
Also in order to test for linear separability what is the metric that is used? Is it the accuracy of the SVM model i.e. the accuracy based on the confusion matrix?
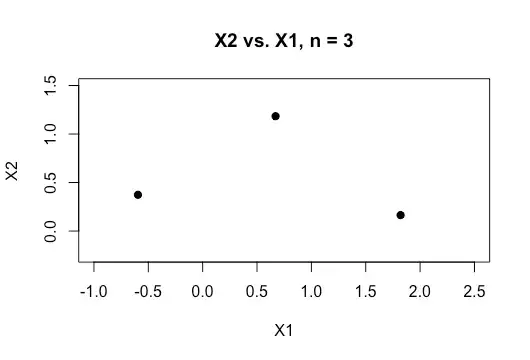
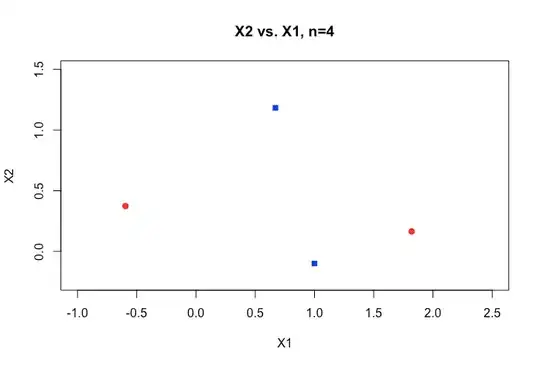
Any help in better understanding this topic would be greatly appreciated. Also below is a sample of a plot of two variables in my dataset which shows how overlapping just these two variables are.


