I'm pretty new to statistics and need advice on how to analyse zero-inflated, thick-tailed, panel distributions. My sample is a count of enterprise births per city and per year across U.S. cities and 14 years. Many cities have 0 counts. A few cities have very high counts, i.e. the distributions in any given year are zipf-like. I wish to test the relationship of my sample with a time-lagged measurement of industrial diversity. This predictor variable is non-zero in every city and year.
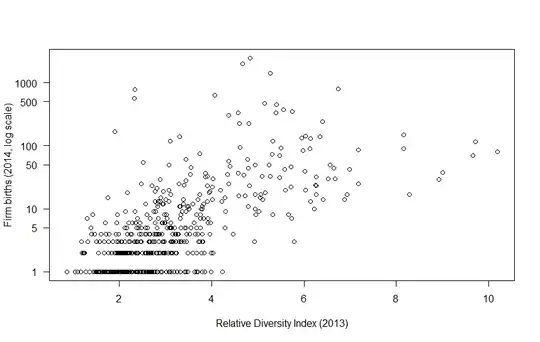
Here's a plot of my 2 variables in 2014/2013. The y-axis is logarithmic, so 376 zero-frequencies are omitted (out of 917 points).
 A similar plot repeats over 14 years, but there are gaps in the data (some cities appear in certain years and not others), so that the panel is unbalanced (1000 cities over 3 to 14 years).
I'm considering testing a power law, thinking that zero- and one-inflated discrete values are (conceptually, not mathematically) consistent with a function converging asymptotically to zero, as well as with the distribution of the non-zero-values of my sample. I'm thinking that panel data should strengthen the cross-sectional relationship (I'm not interested in the longitudinal trend).
Is it a good strategy? Is there a more appropriate one? What techniques would you use? Thank you in advance for any help.