1

I have a table which has data CO2 emission of the world from 1960 to 2011. After going through some tutorial i performed ARIMA method on my dataset,but the prediction of CO2 emission for the next 10 years remains the same.I have already gone through some post,but I am unable to understand it.Below is the Table.

enter image description here

If ARIMA doesn't work , Is there any better method for predicting time series?

Richard Hardy
  • 54,375
  • 10
  • 95
  • 219
  • 2
    Could you edit the post to include a printout of the fitted model (AR order, integration order, MA order, estimated coefficients – some sort of summary)? Also, check [this](http://stats.stackexchange.com/questions/135651/arima-predictions-constant), [this](http://stats.stackexchange.com/questions/125909/forecast-using-arima-models) and related posts. – Richard Hardy Mar 24 '17 at 08:39

1 Answers1

0

What's your step to do the ARIMA model?
You can add an reproducible example.

For ARIMA, I will try the auto.aima function in the forecast package (R language). It will automatically select the best parameter for your.

If the ARIMA actually didn't help you, maybe you should try some other methods. Such as construction features to do linear or nonlinear regression, you can select the important features using a tree-based model.

Those features can be the factors which influence the CO2, or the moving averages of CO2 to capture the trends, Fourier terms to capture the cycle, and so on. I suggest you look into the Kaggle time series contest (like share bike demand prediction), you will learn a lot from it.

Hope you can get ideal results.

Updates:

I am predict the future 5 years total electricity consumption, just 25 years data (correspond 25 rows in training data), is very similar to you question. I using the cubist function in R, it does the regression in the leaf, so combined the benefit of decision tree and linear regression, and have good performance in extrapolate and small samples! prediction result of electricity consumption 
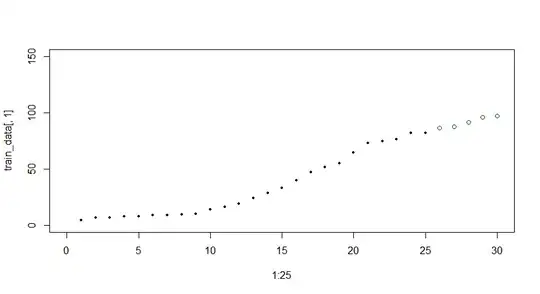
The features in model are last 5 year moving average of electricity consumption, last 5 year moving average of GDP, and the dummy variable of cycle. 5 is the cycle of china's development planning, you can see from the plot. Maybe you can try different steps, and other rolling function.

wolfe
  • 571
  • 5
  • 10
  • Looks better when capital letters are used where appropriate, doesn't it? :) – Richard Hardy Mar 24 '17 at 18:08
  • Thanks it helped me :), and can correlation be used to find factors affecting CO2 emission,because i already found out pearson correlation between CO2 and other variable and some of the correlation score were high like 0.9 – jeffy abraham Mar 25 '17 at 03:17
  • Yes,but the correlation can be because of other unknown factors too . Can a linear regression model between the two variable prove that the correlation is being caused by the first and second variable,not the third unknown variable. – jeffy abraham Mar 25 '17 at 06:24
  • Sorry for unclear comment. I was saying that the highly correlation between independent variable, you can choose any one of them. But if the correlation between independent variable and dependent variable, then you get a good predictor! – wolfe Mar 25 '17 at 08:52
  • @jeffyabraham I have update the answer (add an example), and hope it helps! – wolfe Mar 27 '17 at 12:30