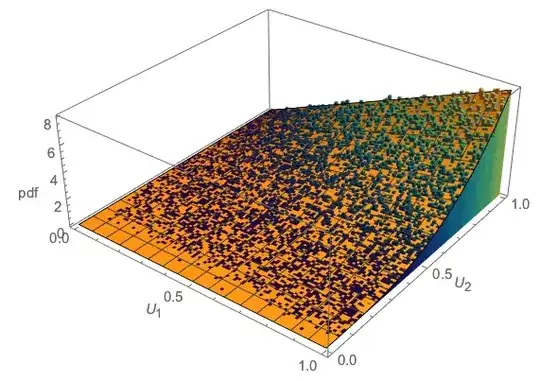
I have a set of data that has following histogram:
I would like to guess it follows an exponential distribution. So I did some goodness of fit using KS test with MATLAB like following:
%% first load the data
fileID = fopen('data.dat','r')
dct= fread(fileID,'float');
fclose(fileID);

%% do distribution fitting
pd = fitdist(dct(:),'Exponential');

%% do ks test
test_cdf = makedist('exp', 'mu',  pd.mu);
[h, p] = kstest(dct(:), 'CDF', test_cdf);
However, I got
h =
     1

p =
     0
which means the hypothesis that my data follows an exponential is rejected.
I am wondering where I got wrong? Or how can I confirm the data I have follows an exponential distribution? Thanks a lot. I am attaching the original data here.
