What can one infer about the dispersion of a dataset when the interquartile range exceeds the median? Does this always indicate a large degree of variability? Are there any other summary statements of this dataset that can be inferred from the size of the IQR relative to the median?
-
1@MichaelChernick - OP is comparing *difference* between 1st & 3rd quartile values with the *actual* median (2nd quartile value). – Martin F Mar 06 '17 at 23:18
2 Answers
Note that the IQR can never be negative, but medians certainly can be negative; it's not clear that it usually makes sense to compare the two, since one is a location measure and the other is a measure of spread.
If you had data that was restricted to be always positive (no such restriction is mentioned, though), you could calculate something akin to a coefficient of variation (by calculating the ratio IQR/median)
This would be measure of relative variability, and would be unitless, like the coefficient of variation is. It might then at least make sense to ask "does such a ratio exceeding 1 indicate a large amount of relative variability?"
However, the answer is, we can't really say; it depends on what counts as "large" for you. There's no clear absolute standard. (There isn't an absolute standard for the CV either - one that would make a particular value count as "large" or "small", though in some application areas you can find rules of thumb -- if you have some assumed distribution and some rule of thumb threshold for CV, it might be possible to find a roughly corresponding rule for IQR/median; at least perhaps under some conditions.)
- 257,508
- 32
- 553
- 939
-
3We can add that IQR/median is undefined for a median of zero and unstable if the median is near zero. These limitations parallel those of the coefficient of variation. – Nick Cox Mar 06 '17 at 19:32
-
In this case, the data are always positive. I was reluctant to use the "traditional" coefficient of variation because my data do not follow a normal distribution, but the non-parametric analogue that you put forth seems like an interesting choice. Are there any other measures that you think would would provide a more powerful means for comparing the dispersion of several datasets for non-normal datasets? – SilvanD Mar 06 '17 at 19:48
-
@SilvanD There is absolutely no reason to suppose that the CV is particularly appropriate for the normal distribution. In fact the CV is utterly useless for the standard normal with mean zero and of dubious use if the mean is negative. On the whole the CV is most appropriate for (generally) right-skewed distributions such as the lognormal or gamma. There is no reason to think that IQR/median is non-parametric; as the median and quartiles are parameters of a distribution. – Nick Cox Mar 06 '17 at 21:56
-
@SilvanD I'd agree with Nick's comments. IQR/median will be unstable if the median is quite small (which can easily happen in some situations), I'd probably be a bit stronger on the point that CV generally isn't appropriate for the normal - not only should variables be positive, I'd tend to consider it mostly for situations where mean and standard deviation tend to move together (and I'd say the equivalent for IQR/median), I'd also agree that IQR/median isn't nonparametric (but it is robust to extreme outliers / has problems where a lot of the distribution is concentrated at a few values) – Glen_b Mar 06 '17 at 23:36
-
@NickCox and Glen_b, both of your comments/answers were very useful in guiding my thinking. To summarize: the CV is just as useful as the iqr/median to compare the relative variation between datasets in normal AND non-normal distributions. Both are similarly not appropriate when the mean is zero or very close to zero (whereby the CV and IQR/median would approach infinity) or negative. – SilvanD Mar 07 '17 at 17:43
-
1Pleased you found my (our) responses helpful. In principle I suppose it's possible that for a bunch of different normals, SD / mean := CV is approximately constant, but that seems rare in practice. As said, approximately constant CV seems to go along with right-skewed distributions. – Nick Cox Mar 07 '17 at 17:47
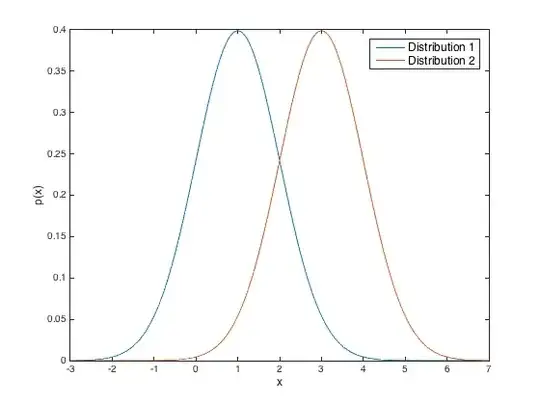
In general, comparing the IQR to the median won't give you any extra insight about the dispersion. For example, consider these distributions:
They have the same IQR; in fact they're identical copies, just shifted along the x axis. But the IQR is greater than the median for distribution 1, and less for distribution 2. Also, consider that any distribution with median less than 0 will have IQR greater than the median.
- 29,014
- 3
- 60
- 99
-
1I am dealing with a strictly positive dataset and didn't even think of this possibility--thank you for the helpful point. – SilvanD Mar 06 '17 at 19:49
-
1The general point also applies to distributions with positive support. For example, a lognormal distribution with $\mu=0, \sigma=1$ has median 1 and IQR ~1.45. Shift it to the right, and you can make the median arbitrarily large without changing the IQR or dispersion. – user20160 Mar 06 '17 at 20:01
