2

My data has 1700 rows and 7 features. I have built a linear regularized (Lasso) model (since I started with around 600 features which were highly correlated). After choosing the best model, I observe that there is drift trend in my residual plot.

Residual Plot

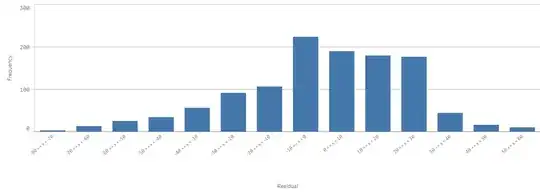
Distribution of error

Now this kind of trend violates normal error assumption of linear regression.

  1. We are overestimating the lower values and underestimating higher values. What steps can I take to handle this issue?
  2. Is it happening because of scarcity of data at both ends?

Please let me know if you need more information about the problem or data.
ug2409
  • 121
  • 4
  • Yes Kjetil I think the thread you mentioned is relevant to me. What I understood from the post was that since the R-Squared value of my model is quite low (0.25), the features I used are not able to explain the variance in Y. Therefore, this variance is correlated with the error term. If I increase the R-Square value somehow, the correlation of Y with error term would decrease. Is my understanding correct? – ug2409 Feb 14 '17 at 14:19
  • Yes, probably. You could investigate that yourself by simulation! For this treason, the plot you have shown (residual v Y) is not a standard ployt to investigate fit. You should instead plot residuals v fit, that is, $\hat{Y}$ or versus individual predictors. – kjetil b halvorsen Feb 14 '17 at 15:42
  • On X axis, it is actually the prediction values and not the real Y values. I have mistakenly give it name 'Target'. I will update the image. – ug2409 Feb 17 '17 at 08:03

0 Answers0