2

Table: Two Regressions Predicting IQ Scores Standard errors are shown in parentheses below the partial regression coefficients. The dependent variable in both equations is IQ scores of the subjects.

                        Model 1                  Model 2
Brain Size (pixels)       .122*                    .200**
                         (.050)                   (.066)
Female                                           -2.599
(female = 1, male =0)                           (11.176)
Height (in.)                                     -2.767      
                                                 (1.447)
Weight (lbs)                                     -0.075
                                                 (0.220)
Constant                5.167                   134.383
Adj R2                   .13                       .27
N                        40                        38 
Glen_b
  • 257,508
  • 32
  • 553
  • 939

2 Answers2

1

In model 2, the intercept represents the mean response when all covariates are set to zero...Because zero are presumably implausible values for those height and weight, looking at the mean response when height=weight=0 is extrapolating well beyond the scope of your data. Because height and weight are negatively associated with the outcome variable in your sample, this extrapolation results in a very large intercept (which should convince you of the dangers of extrapolation).

In model 1 the intercept estimate effectively averages over the sample values of height and weight, rather than quantifying the mean when those two variables (and the others) are zero.

I suggest you center height and weight (and maybe the other predictors). When you do that, the intercept represents the mean response when those predictors are set to their means, which has a more natural interpretation (and doesn't change the overall fit of the model in any way).

gammer
  • 1,456
  • 10
  • 21
  • Thank you but why are both constants dramatically different? Constant 5.167 134.383 – Florence Martin Feb 05 '17 at 00:26
  • See paragraph two. They are different because Model 1 effectively averages over height and weight in the intercept, instead of estimating the mean response when height and weight are both 0 (which is presumably well below the average value for height and weight). Center height and weight (and maybe the other predictors) and you'll find this discrepancy gets much smaller. – gammer Feb 05 '17 at 00:30
  • I see...Thank you so much...Would you happen to know the interpretations of the constant values in both models? – Florence Martin Feb 05 '17 at 00:37
  • In all linear models, the intercept is the estimated mean response when all predictors are set to zero. In model 1, I this just the mean when the brain size = 0 (it effectively averages over the omitted variables). In model 2, it's the mean when brain size, height, and weight are zero, and gender = male. Center your quantitative variables and it represents the mean response when all predictors are set to their means (and the categorical variable is set to its reference value...male in this case) – gammer Feb 05 '17 at 00:43
  • Thank you. I tried to compute a t-statistic for the height coefficient to get the p-value (two tailed) using a t-table and this is what I got, am I in the right place? ..... The sample size is 38 and K = 5, so 38 – 5 = 33. The standard error = 1.447. So I have 33 df and a t-value of 1.447. The t-value shown in the table for 33 df with a 2-tail probability of .05 is 2.035. The t-statistic of 1.447 is much lower than 2.035, so I conclude that its p-value is not <.05.> – Florence Martin Feb 05 '17 at 00:50
  • Yes, you're right that $ t=1.447$ would not be significant at level $\alpha=0.05$. – gammer Feb 05 '17 at 00:52
  • It's also worth reiterating that centering your variables wouldn't change the model fit in any way, and would only change the intercept. Everything else would stay the same. – gammer Feb 05 '17 at 00:53
  • Do you offer tutoring? This answers are helpful? – Florence Martin Feb 05 '17 at 00:54
  • Haha. Sorry, I don't offer tutoring. I'm not sure this site is the proper forum to find a tutor but you can ask questions on a case-by-case basis and someone will probably be able to point you in the right direction. Glad I could help you with this question. – gammer Feb 05 '17 at 00:58
  • I understand....final question....what would you conclude about the effects on IQ of gender and weight in model 2 and why are they worth paying attention to? Also why do I need two different models to predict IQ? Or why bother comparing them? – Florence Martin Feb 05 '17 at 00:59
  • It depends on the application (which I know nothing about). It doesn't look like weight and weight are significant after accounting for gender and brain size but, if they are known to be important in the context of the application, you should keep them in regardless, especially because brain size appears to be more important after controlling for those effects. This change could indicate that height and weight might be important in this case, even if they're not individually significant (e.g. if they are known confounders). Especially with the small sample size. Hard to say much more. – gammer Feb 05 '17 at 01:16
  • Fair enough assessment. – Florence Martin Feb 05 '17 at 01:24
0

The constant represents the y-intercept when all the variables that are in the model are zero. If you add a variable with a non-zero mean it may have a dramatic effect on the intercept. Specifically, if the IVs are themselves related, the coefficients of the smaller model (including the intercept) should be expected to be different.

For some discussion of this sort of effect, see the section in Intuition in the wikipedia article on omitted variable bias. The impact of the intercept is mentioned there.

[There are several posts on site discussing the effect on coefficients of variables included in both models -- e.g. see this one, but as with that question, they typically tend not to focus on the intercept]

(This effect doesn't imply that the coefficients of the larger model are themselves unbiased; there may be further important variables that are in turn related to variables already in the model)

However, the intercept may change even when the IVs are unrelated to each other, as long as the means of the additional variables are not 0. If the means of the omitted variables are large and they're related to the DV, the effect can be substantial.

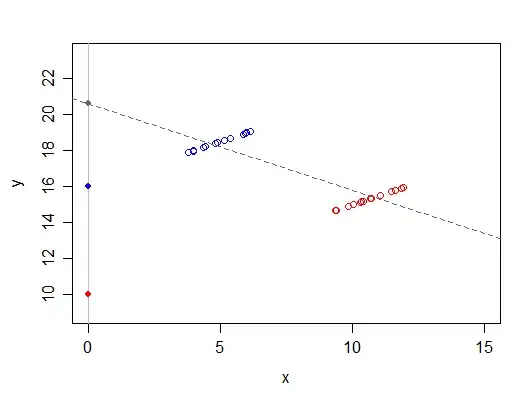
Consider the following simple example, which has no error in it for simplicity of illustration (the data are represented by open circles, the filled circles mark potential intercept-values depending on the model):

plot showing y plotted as a function of x, with grouping variable z distinguished by color

The response, $y$ is a linear function of two variables, $x$ and a grouping variable $z$. If you code the lower (red) group as $0$ then the fitted intercept will be $10$. If you code the upper (blue) group as $0$ then the fitted intercept will be $16$. If you omit the variable $z$ (in effect, both groups are now coded as $0$), the intercept will be at the grey dot (close to $12$ in this case). If $x$ and $z$ were perfectly uncorrelated the coefficient of $x$ would be correct (though its standard error would be inflated), and the intercept would be at a weighted average of 10 and 16, where the weights are proportional to the group-sizes. Note that here the omitted variable is small (its mean is 0.5) and its effect isn't especially large. If its mean was larger or the coefficient were bigger, the impact on the intercept can be correspondingly larger.

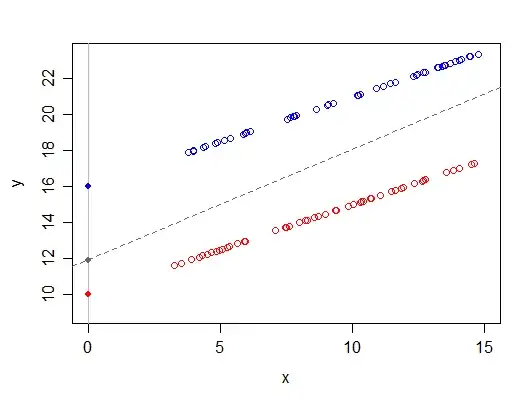
In some situations, particularly when some IV means are large and the IVs are strongly related, the effects on intercept may be really large. Taking the same relationship above (which is not at all an extreme example), by simply omitting some points, we get a dramatic effect on the intercept:

same relationship, but omitting some points changes the effect of omitting the grouping variable in the model

Glen_b
  • 257,508
  • 32
  • 553
  • 939
  • 1
    After the first two sentences, I think you're getting lost in the weeds with this lengthy digression about omitted variable bias. The problem is that the intercept estimate in the OP's model represents an mean response estimate that extrapolates well beyond the scope of the data. The answer is to center the predictors. – gammer Feb 05 '17 at 00:29
  • The question was not "how to eliminate the change" but "why did it happen". So I think your criticism entirely misses the point of the question. *Why* it happened in such a big way in the OP's case is largely omitted variable bias (which is why it's important to discuss it), but discussions of the effect usually aren't focused on the impact on the intercept. – Glen_b Feb 05 '17 at 00:33
  • why it happened is because you're estimating the mean response when height=0 and weight=0, which is I guess around 130. Not that this estimate is meaningful....Because it's just extreme linear extrapolation... – gammer Feb 05 '17 at 00:34
  • You might note the very first sentence in my answer -- the very first sentence I typed when composing it. – Glen_b Feb 05 '17 at 00:45
  • Yeah. You might note the first five words of my first comment. I liked the first two sentences (even if I think it wouldn't hurt to place it in the context of the example presented by the OP). I think the rest of it goes well beyond the scope of the question, which was my point. Anyway, you do you, Glen_b. – gammer Feb 05 '17 at 00:46
  • Why the downvotes on this one? Misinterpretation of the intercept (it's a conditional expectation after all) and omitted variable bias are obvious explanations to the difference between models. – Firebug Nov 09 '17 at 13:21