I have a 2D field of an Eulerian scalar and I'm looking for a statistical index to quantify how clustered or grouped the field is.
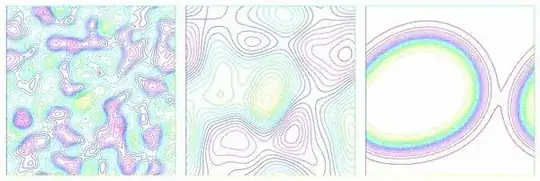
Consider the figure below for example (which is not mine, since I can't disclose my data; I got it from google):
If I do the mean or standard deviation on all 3 pictures, the result might be the same, but the arrangement of the values clearly isn't.
A PDF also is not appropriate, since the same data (not in the above picture, though) could have the same PDF but different arrangements for the values, and therefore large and small clustering for the same PDF. An FFT also isn't ideal, since you only change one plot for another.
Ideally I'd like a "clustering number" for each picture. Where it would be close to zero in the leftmost figure, and close to one in the rightmost.
I have checked answers like this but from what I got they only apply to lagrangian data, that is, individual points in continuum space.
EDIT
To explain better, they only work if you have a list of particles and their exact position (lagrangian data). What I have is a grid in space, and each grid cell has a concentration of particles in it (eulerian data).
Cheers
PS: I don't really have much idea on which tags to put on this. Please feel free to improve my tags.
