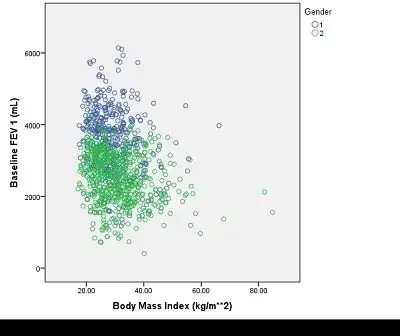
I have found that the correlation coefficient for the association between BMI and FEV1 in total subjects is greater than the corresponding values for males and females. How could it be explained?
Asked
Active
Viewed 81 times
0
-
2Look at a scatter plot with the groups distinguished. Very likely the groups overlap such that the linearity of the combined group is greater. Check the forum for "SImpson's paradox". Less common, but possibly better terminology is "amalgamation paradox" for (initially) surprising behaviour when groups are amalgamated. – Nick Cox Jan 22 '17 at 12:19
-
Thanks dear Nick, but the subgroups(males and females) are independent categories, so the overlapping is unlikely. – Rosad Jan 22 '17 at 13:31
-
Try editing your question to include the scatter plot with the groups distinguished in some way as @NickCox suggests so we can talk about your actual data rather than purely theoretically. You could also search on terms like ecological bias or ecological fallacy which may help you. – mdewey Jan 22 '17 at 15:38
-
I mean overlap in terms of regions on the scatter plot. I don't expect same means, SDs and distribution shape for males and females. – Nick Cox Jan 22 '17 at 15:53
-
Here is the scatter plot – Rosad Jan 22 '17 at 16:13
-
An explicit example is given in my answer at http://stats.stackexchange.com/questions/13314/is-r2-useful-or-dangerous/13317#13317. That ought to make it clear that it's possible for the correlations in males and females separately to be as small as $-1$ while the overall correlation can be arbitrarily close to $+1$. The dataset $(0,1),(1,0)$ for males and $(N,N+1),(N+1,N)$ for females provides an example: you can make the overall correlation as close to $1$ as you like by making $|N|$ large. – whuber Jan 22 '17 at 21:41
1 Answers
1
The blue dots tend to have higher FEV and lower BMI (on average). So when you aggregate both groups together you have a longer thinner ellipse lying roughly from north west to south east across your plot than you have for either of the separate groups. In extreme cases you can have relationships within groups of different sign from the overall one but I do not think that is what you have here.
mdewey
- 16,541
- 22
- 30
- 57
