1

I currently have a 2D probability density function and need to draw a 2D ellipse that circumscribes 50% of the probability "mass" (if that is the right terminology).

I see lots of articles on how to draw these ellipses for traditional x,y scatter-plots, but none for 2D probability density functions.

My attempt involves evaluating the bounds for which the double integral of the pdf equals 0.5. Unfortunately this gives me a "box" that contains 50% of the probability mass instead of the ellipse that I need.

Any ideas on what I could try or how I could modify the box to be an ellipse? Here's a source that could be useful in some way. Specifically pg.24.

http://web.ipac.caltech.edu/staff/fmasci/home/astro_refs/GaussianPDFs_ErrorProperties.pdf

Thanks for your time.
  • 1
    **1**. Is your pdf completely specified or is this to be based on data? $\:$ **2**. If your 2D pdf is bivariate Gaussian (or if you have some nonparametric information like a histogram say but you want to assume bivariate Gaussian to draw the ellipse) you should specify that in the first paragraph. Conversely, if it's an ellipitcal pdf but something other than Gaussian (e.g. bivariate-t) you should specify that. If it's neither you should explain how you intend this ellipse to be arrived at. – Glen_b Jan 17 '17 at 23:25

2 Answers2

1

A simple approach that may actually be enough would be to sample many points from your given PDF and then calculate an ellipse covering 50% of these.

Note that there are infinitely many such ellipses, so you need to add further constraints to obtain a well-posed problem. One possible constraint is that your ellipse should have the minimum volume among all ellipses covering 50% of the simulated points.

A good keyword to search for is "minimum volume covering ellipsoids". A good reference is "Computation of Minimum-Volume Covering Ellipsoids" by Sun & Freund (Operations Research, 2004).

An abstract solution should be possible, where you would set up a straightforward constrained optimization problem. The constraint would be that integrating your PDF over the ellipse should yield exactly 0.5 (or at least 0.5, may be easier), and the target function to be minimized would be the area of the ellipse.

Stephan Kolassa
  • 95,027
  • 13
  • 197
  • 357
1

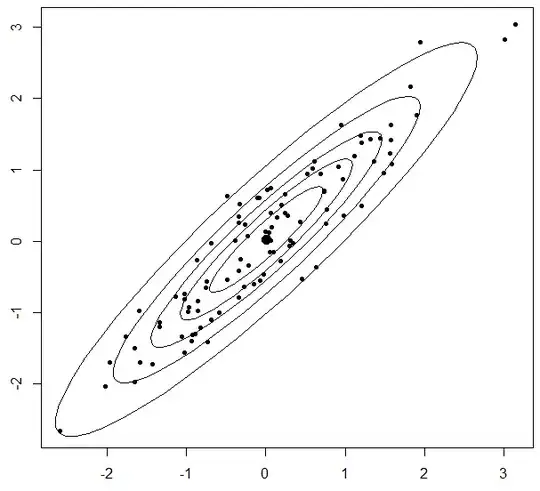
I am not quite clear if you are asking for the algorithm to compute the analytic form of the ellipses or just plot them. In R, there is a function for plotting the ellipses based on the assumption of a multivariate Gaussian distribution - dataEllipse in the car package.

Here is a quick example.

library(car)

## generate data and plot points
set.seed(2017)      ## for reproducibility
x = rnorm(100)
y = x + rnorm(100, 0, 0.5)
plot(x,y, pch=20)

## Add the ellipses
dataEllipse(x,y, levels=c(0.2,0.4,0.6,0.8,0.95),
    plot.points=FALSE, col=1, lwd=1)

Data with density ellipses

I have drawn the 20%, 40%, 60% 80% and 95% lines.

G5W
  • 2,483
  • 1
  • 9
  • 21