0

I have a sample of 347 subjects. While diagnosing the fitted regression model, I observed a minor bump (on the positive side) over the 45-degree line on the PP plot. When I conducted two of the formal tests available in SPSS, they rejected the null hypothesis that the data is from a normal distribution.

The normality violation, if I understand correctly, has little effect on estimated-betas in a large sample. Is my sample size of 347 big enough to ignore violation of normality of residuals?

If yes, may I ask for a few solid references I can use as justification? If no, can I still bypass transforming my DV and report bootstrapped parameters?

PS:- My study is on consumer behavior. The objective of my analysis is more to understand the relationship between my IVs and DV, and less about prediction.

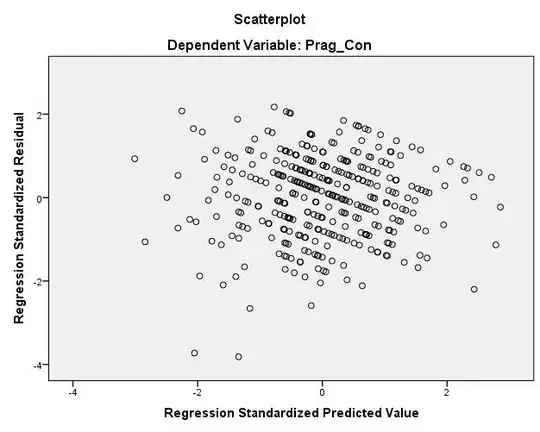
Adding diagnostic plots.....
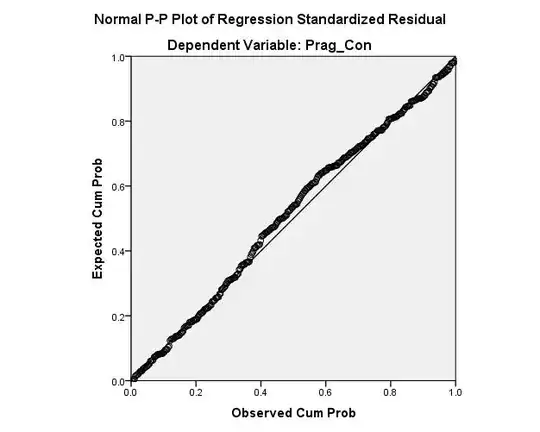
Normal PP Plot Residuals vs Predicted

  • 4
    Whether the **data** are from a normal distribution is not crucial at all. Are you saying that you tested the **residuals** for normality? Instead of trying find witnesses that fit what you intend to do any way, you'd get better advice by showing us thee diagnostics. The main question from diagnostics is not whether they sanctify a model as being significant or insignificant in the right places, but whether you can improve your model by recasting it. That includes wanting to understand the relationship. – Nick Cox Jan 13 '17 at 12:07
  • 1
    Added variable plots are good here; whether they are available in SPSS under that or another name I can't say. – Nick Cox Jan 13 '17 at 12:08
  • I have uploaded the normal pp plot and the residuals vs predicted plot. By added variable plots, I guess you mean partial regression plots that plot each of the IVs vs DV. I tried to upload them too. But, unfortunately, for lack of reputations I am only allowed to use 2 links in my post. – Vighnesh NV Jan 13 '17 at 17:08
  • PP plots I don't like nearly as much as QQ plots. Added variable plots show the response versus each predictor, yes. (On versus, see http://stats.stackexchange.com/questions/146533/versus-vs-how-to-properly-use-this-word-in-data-analysis) – Nick Cox Jan 13 '17 at 17:12
  • You have clear lines in your residuals, suggesting they only come in discrete values. What is your dependent variable? – gung - Reinstate Monica Jan 13 '17 at 17:21
  • @gung That point was raised separately in the OP's earlier thread http://stats.stackexchange.com/questions/256005/apparent-correlation-between-standardized-residuals-and-predicted-in-regression This looks like a different response, but the principle's established. – Nick Cox Jan 13 '17 at 17:36
  • @NickCox, Thanks much for the replies. I will add the partial plots soon. Meanwhile, may I know the reason behind your preferring QQ plots over PP plots? I have read both can be used for regression diagnostics. – Vighnesh NV Jan 14 '17 at 09:10
  • QQ plots are easier to interpret and more honest about the data. – Nick Cox Jan 15 '17 at 08:30

0 Answers0