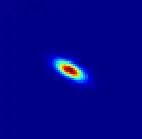
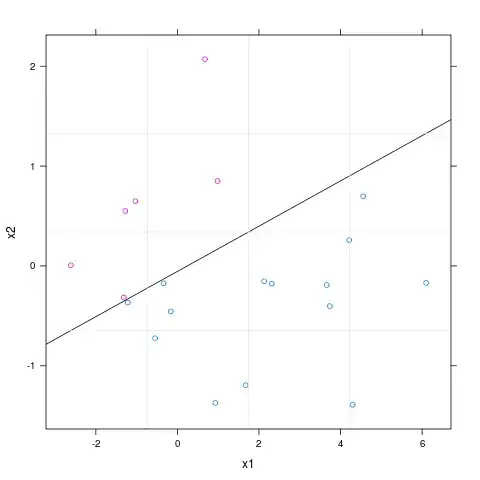
I have a source of data that follows this bivariant Gaussian distribution:
The same source of data produces this 2-dimensional histogram:
Computing the 2d histogram is much less expensive however the source is better described using a Gaussian. My question is: is there a way of approximating the 2d histogram to the bivariate Gaussian shown above? Maybe some sort of filtering using the mean and covariance from the source?
Both distribution maps (i.e. the images from above) are generated from values ranging [0,255]. In other words, my source outputs integer values between 0 and 255.

