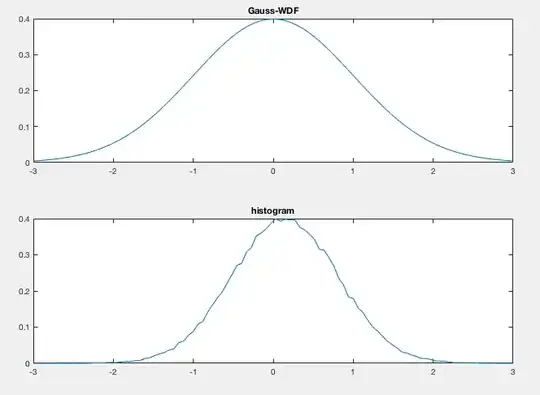
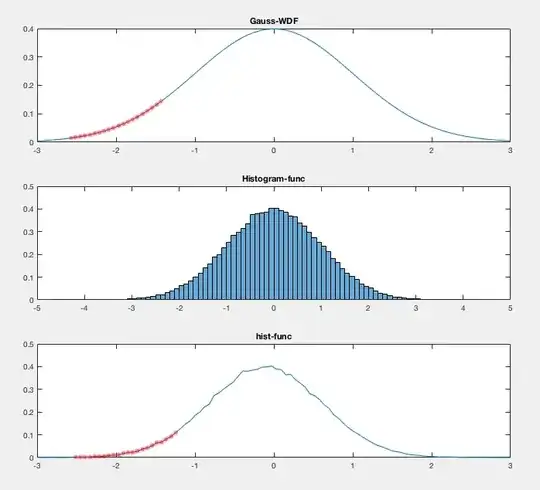
I don't understand why there is a difference between the pdf and the normalized histogram (based on randn) I plotted in matlab. Especially from -2 to -3 the difference is huge.
Why is the normalized histogram so far of from the ideal pdf?
Here is my code:
q = [-3:6/99:3]; % x-Axis
f_q = (1/sqrt(2*pi*1))*exp(-0.5*((q-0)/1).^2); % Gauss pdf

n_in = 100;
y = randn(1,10000);
[n x] = hist(y,n_in); % hist func
n_norm = (n ./length(y)) ./(x(2)-x(1)); % normalize hist func
figure;
subplot(3,1,1);
plot(q,f_q);
title('Gauss-WDF')

subplot(3,1,2);
histogram(y,'Normalization', 'pdf');
title('Histogram-func');

subplot(3,1,3);
plot(q,n_norm);
title('hist-func');
EDIT:
Plot with exually distributed axis.

The histogram is based on a normal distributed random function. So it should follow the pdf of a normal distribution. But apparently it doesn't as you can obviously see. I don't understand why.
