0

I have a dataset where each data point is characterized by two variables: X(time) and Y(volts).

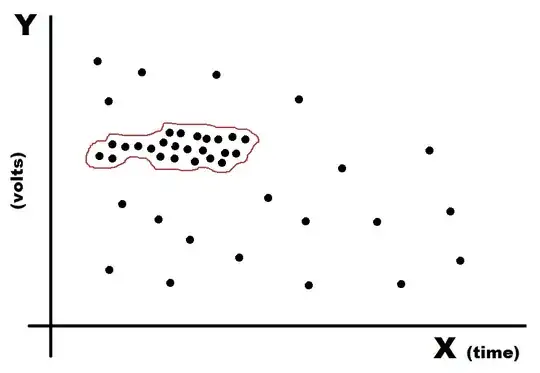
When I plot my data it would be something like this:

enter image description here

The plot shows some data points created a cluster (I demonstrated those with the red boundary). The other data points are noise points which are not important for me. I finally found "DBSCAN clustering" could help finding true data points (points in the red boundary). In particular, two parameters needed to be determined for running this method: (1) Distance (2) MinPts.

I have a question: - How I can find a correct value for "eps" (distance)?

BTW: (1) two variables are not on the same scale. (2) I wanna use R-programming for clustering process.
Harry UNL
  • 39
  • 6
  • Can you post an example dataset that goes with the figure? – gung - Reinstate Monica Dec 12 '16 at 18:01
  • 1
    How do you *know* DBSCAN is "the most appropriate" when you apparently did not figure out how to use it? Aldo, please use the search function instead of posting duplicate questions; if possible show your real data rather than an overly simplified sketch. – Has QUIT--Anony-Mousse Dec 12 '16 at 21:01
  • Oh, and since your variables are *not* on the same scale, I'd assume *Generalized* DBSCAN may be more appropriate, as you can then treat the two variables independently. Don't just use Euclidean distance! – Has QUIT--Anony-Mousse Dec 12 '16 at 21:05

0 Answers0