This will be an R-centric answer. One approach is to wrap the call to lm in a function which is passed the breakpoint and constructs a regression conditional upon that breakpoint, then minimize the deviance of the fitted model conditional upon the breakpoint by just iterating over the possible values for the breakpoint. This maximizes the profile log likelihood for the breakpoint, and, in general (i.e., not just for this problem) if the function interior to the breakpoint iteration (lm in this case) finds maximum likelihood estimates conditional upon the parameter passed to it, the whole procedure finds the joint maximum likelihood estimates for all the parameters.
For example:
# True model: y = a + b*(obs. no >= shift) + c*x
# a = 0, b = 1, c = 1, shift at observation 31

# Construct sample data
x <- rnorm(100)
shift <- c(rep(0,30),rep(1,70))
y <- shift + x + rnorm(100)

# Find deviance conditional upon breakpoint
lm.shift <- function(y, x, shift.obs) {
  shift.var <- c(rep(0, (shift.obs-1)), rep(1, length(y)-shift.obs+1))
  deviance(lm(y~x+shift.var))
}

# Find deviance of all breakpoint values
dev.value <- rep(0, length(y))
for (i in 1:length(y)) {
  dev.value[i] <- lm.shift(y, x, i)
}

# Calculate profile-ll based confidence interval
estimate <- which.min(dev.value)
profile.95.dev <- min(dev.value) + qchisq(0.95,1)
est.lb.95 <- max(which(dev.value[1:estimate] > profile.95.dev))
est.ub.95 <- est -1 + min(which(dev.value[estimate:length(y)] > profile.95.dev))

> estimate
[1] 30
> est.lb.95
[1] 28
> est.ub.95
[1] 33
So our estimate is 30 with a 95% confidence interval of 28 - 33. Pretty tight, but that was a pretty big shift relative to the standard deviation of the error term too.
Note some messiness is involved in calculating the profile log-likelihood based confidence interval, but the basic idea is to find the largest index less than the estimate with a deviance greater than the cutoff level for the lower bound and the smallest index larger than the estimate with a deviance greater than the cutoff level for the upper bound.
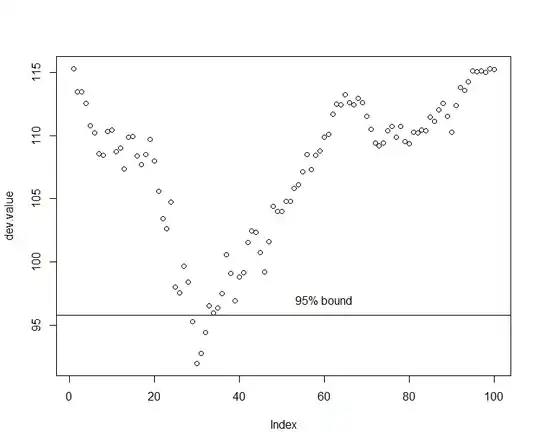
One really should plot the deviance curve out, just to make sure you don't have multiple local minima that are close to as good as each other, which might tell you something interesting about the assumed model (or the data):