6

With piecewise, or so-called broken-stick regression it is possible to fit two lines to data,

enter image description here

But what if I wanted to fit data to two lines, one main and one branch which connects to a primary line not necessarily on end points. This would a "branching stick" regression, for lack of a better word.

enter image description here

I am familiar with gradients, derivatives, would that be a feasible method? I guess one can formulate the main line, and another that starts / must be within / on the main one, and take the gradient of this formula, then optimize.. ?

Are there any other methods for this?

Note:

BBSysDyn
  • 1,002
  • 1
  • 9
  • 17
  • 1
    If you have a binary variable which distinguishes the groups then you could fit an interaction between it and your x variable – mdewey Nov 16 '16 at 12:13
  • Unfortuntely I do not have that binary variable. The data comes as one, the main line and the branch data are all mixed. – BBSysDyn Nov 16 '16 at 12:21
  • 1
    A lead on your piece-wise regression would be the MARS method (https://en.wikipedia.org/wiki/Multivariate_adaptive_regression_splines). That won't solve your problem, but might provide further leads. – Wayne Nov 17 '16 at 13:16
  • 1
    The branching lines look like linear separating hyperplanes. Of course there are no real categories to separate, but I wonder if techniques like LDA could be modified for this somehow - minimizing the squared distance to the nearest hyperplane for all the points... – jwimberley Nov 17 '16 at 16:47

3 Answers3

3

The problem with your "branching stick" regression is that it is very difficult to parametrize, as it is not easily described by a threshold and indicator function as in the segmented regression case.

A first way to relax the segmented regression is by not requiring that the lines join, this could give you a first idea. This is called usually threshold regression, a sort of generalisation of segmented regression. However, you will have no overlap of lines as you have in your "branching stick"

The most general (parametric) model is a mixture regression (or latent class regression), where you fit two lines, one for each group, where membership to one of the two groups is attributed based on a data driven procedure. This is a very general model, but it won't guarantee that the two lines cross as you wish.

So if you really want this exact "branching stick", you could run a mixture regression imposing the specific functional form you are interested. This will require a fair amount of coding, but basically just implies modifying the standard mixture regression algorithms (mostly based on EM).

Matifou
  • 2,699
  • 14
  • 25
1

I don't know of a fully worked out solution. If the data really look like your example, you could try doing cluster analysis first, then separate regressions in each cluster. You would probably want to try several clusters.

Another possibility, if the data set is not too large, is to try to do pairs of regressions on a great many different splits of the data. Even with moderate size data, the total possible splits grows very fast, but it is probably possible to limit the number of splits quite a bit, either on an ad-hoc basis (it looks like this!) or maybe some more principled approach of searching through splits.

Peter Flom
  • 94,055
  • 35
  • 143
  • 276
  • Cluster analysis might work.. Hmm.. What if I fit two Gaussians through Expectation-Maximization, but I make the Gaussian _really_ thin, not sure how to force that, through certain values in the covariance matrices perhaps.. Then I turn the information from Gaussians into lines, somehow. – BBSysDyn Nov 16 '16 at 13:08
  • 1
    .. or not force anything, I can simply run EM with two Gaussians, which would naturally elongate in one direction to fit data, but I need a general direction for a line anyway. – BBSysDyn Nov 16 '16 at 13:21
0

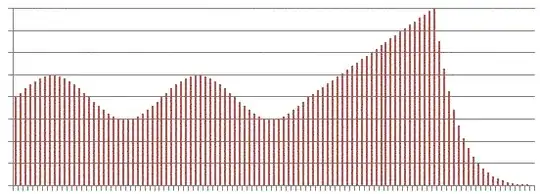
The first case mentioned in the question can be solved with a very simple method (not iterative, no initial guess) thanks to the piecewise linear regression given page 12 of the paper : https://fr.scribd.com/document/380941024/Regression-par-morceaux-Piecewise-Regression-pdf The result $\quad\begin{cases} y=p_1x+q_1 & x<a_1 \\ y=p_2x+q_2 & x>a_1 \end{cases}\quad$ appears on the next figure : enter image description here

The second case, so called "Branching Stick regression" is substantially different because the intended function is multi-valuated on a range of $x$.

In fact, this case is a sub-case of the "degenerated conic regression" which is treated page 19 in another paper : https://fr.scribd.com/doc/14819165/Regressions-coniques-quadriques-circulaire-spherique .

The sought multi-valuated function must be of the second order at least, for example a conic section of equation : $$a_{02}y^2+a_{20}x^2+a_{11}xy+a_{01}y+a_{10}x+1=0 \tag 1$$ A degenerate case is the case of two straight lines $y=p_1x+q_1$ and $y=p_2x+q_2$ , which equation is : $$(p_1x+q_1-y)(p_2x+q_2-y)=0 \tag 2$$

A linear regression gives approximate values of the coefficients $a_{02},a_{20},a_{11},a_{01},a_{10}$ .

As explained in the referenced paper, the equations $(1)$ and $(2)$ match if there is no scatter on data. In case of scattered data, the result of regression is an hyperbola equation $(1)$, close to the asymptotes equation $(2)$. The formulas to compute $p_1,q_1,p_2,q_2$ are provided in the referenced paper.

A numerical example is shown on the figure below. The hyperbola computed from the regression is drawn in green, the asymptotes in blue. The coordinates of the "Branching point" are $(x_c,y_c)$.

enter image description here

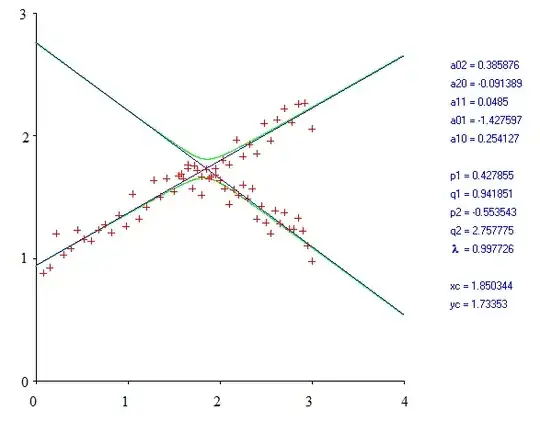
In the referenced paper, it is pointed out that the method of "degenerated conic regression" fails if the scatter of data is too large because the gap between the hyperbola and the asymptotes becomes too large.

JJacquelin
  • 551
  • 3
  • 8